BECOME A GAME WRITER
MONDAYS & WEDNESDAYS
5:30 PM PST / 8:30 PM EST
DATA ANALYSIS IN HEALTHCARE


- 4 MAR - 20 APR (7 WEEKS)
- MONDAYS & WEDNESDAYS
- 5 PM PST / 8 PM EST
4 MAR 2026 - 20 APR 2026
DURATION:
7 WEEKS
MONDAYS & WEDNESDAYS
5 PM PST / 8 PM EST
Data is healthcare’s greatest game-changer. Reshape your approach to discovering medical concerns, explaining them, and creating solutions.
Jesse Andrist has spent over a decade making data-driven decisions. In 7 weeks, you’ll gain healthcare data literacy to aid patients, employees, and your career.
THIS COURSE IS FOR YOU, IF...
-
YOU'RE A HEALTHCARE PROFESSIONAL ADVANCING PATIENT CARE
Create solutions that improve policies & operational decisions. Take your skills from being a healthcare professional, administrator, or IT specialist and apply them to clinical issues.
-
YOU NEED TO COMBINE ANALYTICS WITH HEALTHCARE FOR WORK
Improve patient outcomes. Practice keeping your data clean, secure, and ethical. Learn the full cycle of working with healthcare data and the techniques to present your findings.
-
YOU WANT TO LEARN THE FUNDAMENTALS OF HEALTHCARE DATA
Learn to visualize your reports. Reinforce healthcare resolutions with specific remedies. Gain the experience you need to go beyond data entry and towards data proficiency.
-
YOU'RE COMPLETELY NEW TO THE HEALTHCARE INDUSTRY
Welcome, healthcare hero. Your training will include using Excel, Power BI & Tableau. Explore the American healthcare system, five datasets, and ANOVA. Get ready to save lives and build your portfolio.
Our students work in 1600+ companies worldwide
Dig into data with Excel, Power BI, and Tableau. Familiarize yourself with common patterns and descriptive statistics. Decipher the significance of multiple means in your datasets.
Learn as you go. Analyze patient diabetes data, perform regression analyses, and conduct research. Organize your data to tell a story that yields results.
Talk with experts. Each student will have the opportunity to schedule a 1:1 session with the instructor and a chance to engage with guest speakers. Find the career guidance you need and understand what prospects await.
- Director of Data & Analytics, Hospital Practice, Mayo Clinic Rochester
- Has over a decade of analytics experience, with five years in healthcare
- Spearheaded modeling and planning for Mayo Clinic's COVID-19 response
- Leads analysts & data scientists to improve patient results
- Builds teams and pioneered the data operations within Rochester Hospital Practice

- Excel basics
- Navigation and interface
- Functionality
- Practical applications
- Pivot tables
- VLookup
- Conditional logic
- Uploading data
- Table creation and management
- Statistical adjustments
- Chart representations
- Uploading data
- Dimensions vs. measures
- Creating visualizations
- Creating dashboards
Our first lesson begins! We'll explore the current state of healthcare in the United States and discover how advanced analytics are revolutionizing the industry. Understand patterns behind healthcare data and gain insights that could shape the future of medicine.
- Harnessing healthcare data for insights
- Defining the Triple Aim
- Analyzing healthcare data: importance and interpretation
- Types of healthcare analytics: descriptive, diagnostic, predictive, prescriptive
Assignment #1: Resume Prep
Let's kick off by dusting off that resume. Lets prep this resource to be a great sales tool to communicate your value.
From decoding HIPAA to uncovering the process of healthcare fraud detection, this class will equip you with the knowledge and insights you need to navigate the intricate web of data governance within organizational landscapes.
- Importance of HIPAA and healthcare data confidentiality
- Identifying protected health information (PHI)
- Role of data governance in healthcare data protection
- Ethical applications of advanced analytics in healthcare
- Detecting healthcare fraud
Assignment #2: Portfolio Prep
Create a working document where you can share your data problem-solving skills with future employers.
Take another step toward turning data into insights. Examine additional advanced charts, profiling, and data presentation, learning the ropes of visual storytelling.
- Identifying your data
- Profiling the data
- Describing distributions numerically: mean, median & standard deviation
- Graphical representations of data: histograms & bar charts
- Best practices for data presentation
What are the preliminary phases of data analysis? You’ll learn how to import data into Excel and tackle everything from data cleaning to merging different sources.
- Healthcare data sources
- Excel data importation & data cleaning
- Handling missing data
- Data management techniques
- Merging & joining data sources
- Pivot tables, charts, data profiling & limitations of Excel
Assignment #3: Job Search Approach
Get familiarized with the current job market and start targeting your unique value to a few key jobs.
Learn the ABCs of profiling, building visuals – understand what’s hidden within the numbers. We'll dive into the essentials in Tableau and Power BI.
- Identifying your data
- Profiling your data
- Building visuals
- Best practices for data presentation
Assignment #4: Descriptive Statistics and Data Visualization
Utilize descriptive statistics and data visualization techniques to interpret and communicate healthcare data effectively.
We’ll be deciphering whether two means truly stand apart in significance and relevance. Master conducting t-tests and emerge with a newfound confidence in statistical comparisons.
- T-test basics
- Assumptions & limitation of t-tests
- Interpreting t-test results
- Using T-tests the right way
Assignment #5: Understanding Two-Sample T-Tests for Health Outcomes (Quiz)
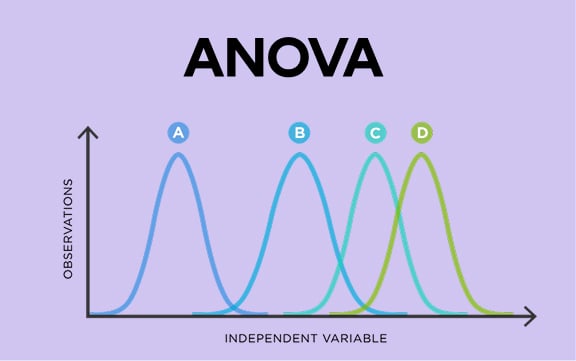
Unlock the power of ANOVA and other advanced statistical methods to unearth meaningful differences between multiple groups in healthcare datasets.
- T-tests review
- Chi-square test overview
- ANOVA test overview
- Introduction to regression
- When to use each method
Assignment #6: Advanced Statistical Methods (Quiz)
From fitting lines to making predictions, we'll explore single and multiple regression techniques, tackling practical applications and case studies along the way. Let's crunch some numbers.
- Single linear regression & multiple regression essentials
- Model fitting & evaluation
- Result interpretation & prediction
- Incorporating multiple predictors
- Handling multicollinearity & interactions
- Practical applications
Assignment #7: Regression Analysis Using Tableau/Power BI (Optional)
Utilize Tableau to conduct regression analysis on patient outcome data related to diabetes, presenting findings in a visually compelling format.
Let's play detective with data. We'll navigate scatterplots, correlation, and even dip our toes into regression – all with a sprinkle of data magic using Tableau.
- Exploring relationships and patterns
- Scatterplot and correlation
- Demo: Tableau & Power BI
Assignment #8: Investigating Relationships in Hospital Length of Stay Tableau or Excel
Analyze relationships between variables using patient hospital length of stay data, gaining insights into healthcare trends and outcomes.
Explore the nitty-gritty of different sampling designs, learn how to tailor them to specific scenarios, and uncover the secrets behind effective research design.
- Question-driven research
- Sampling
- Different types of sampling designs
- Research design
- Causal inference based on research design
Assignment #9: Question-Driven Research Design (Quiz)
Get the lowdown on quality healthcare and how to measure it like a pro. We’ll touch on KPIs, metrics, and optimizing patient care & organizational performance.
- Defining healthcare quality and value
- Understanding measures, metrics, and indicators
- Exploring the role of key performance indicators (KPIs)
- Achieving performance goals in healthcare organizations
Assignment #10: Evaluating Healthcare Quality Improvement Initiative (Quiz)
Transform boring data into stories that resonate with your audience and leave a lasting impact. We'll explore how to weave compelling narratives, jazzing up numbers, and leaving stakeholders hanging on your every chart.
- Optimal data visualization techniques & information presentation methods
- Essential report background details
- Tailored communication strategies for stakeholders
- Case Study: Data-driven surgery enhancements at Mayo Clinic
- Demo: Power BI
Assignment #11: Mastering Data Storytelling Techniques (Optional)
Transform healthcare data into compelling narratives that resonate with diverse audiences.
AI is transforming patient care. Discover effective strategies for leveraging these technologies in healthcare analytics. We'll explore cutting-edge trends, real-world case studies, and discuss the exciting possibilities AI holds.
- Defining AI
- Revolutionizing patient care with AI solutions
- Harnessing Generative AI in healthcare analytics
- Case Study: Palliative Connect by Penn Medicine
- Discussion: Exploring AI's role in healthcare data analytics
Assignment #12: Nurse Attrition Executive Briefing
Analyze nurse attrition data to develop executive-level insights and strategies, addressing critical workforce challenges in healthcare.
Final session! Learn how to ace job interviews, adapt to shifting roles, and showcase your skills with finesse, all while soaking up invaluable insights from our industry experts.
- Career guidance
- Job role adaptation
- Aptitude demonstration
- Industry insights with a guest speaker
Assignment #13: Resume and Portfolio Additions
Delve into the transformative potential of artificial intelligence in healthcare analytics, exploring its implications and applications.
What our students say

"I really enjoy the format of the course. Lectures with real life examples and an ongoing case study. Also built in 20 minutes at the end of each class for questions is helpful."

"Overall I'm impressed with the level of detail and explanation around particular topics and subjects. There's a real depth to each module which for learning allows the information to stay in your brain."

BECOME AN ART DIRECTOR
"The group activities, they allow us to interact and exchange ideas, plus the way it is structured is challenging and mind twisting as we collaborate in different parts of the ideation."

"I enjoyed the structure of the class. I like how we learned about a topic and practiced it in the workshops. It’s helped me to apply what I learned!"


 TRUSTED BY


