- MAIN PAGE
- – elvtr magazine – EXCEL FOR BEGINNERS: ESSENTIAL TIPS AND TRICKS TO GET STARTED
EXCEL FOR BEGINNERS: ESSENTIAL TIPS AND TRICKS TO GET STARTED

Whether you're a student, professional, entrepreneur, or someone seeking to manage personal finances effectively, mastering the basics of Excel is a must. It is not just a spreadsheet program. Even with basic skills, you can create budgets, analyze sales figures, or track personal goals.
Professionally, Excel is useful in many industries. It allows you to manage projects, track finances, and analyze data. Moreover, Excel's relevance extends beyond the workplace. It empowers students to organize and analyze academic data. Entrepreneurs can leverage Excel to create financial models, forecast sales, and monitor business performance. Even in personal life, Excel simplifies budgeting, tracks expenses, and aids in planning events or trips.
In this article, we will explain how to use basic Excel features for beginners and suggest ways you can further master your skills using spreadsheets.

Memorize some shortcuts
You don’t need to know all shortcuts to get started. However, it will save you some time if you memorize the basic ones. You can already be familiar with shortcuts from this list, as many of them apply not only to Excel.
Start with learning this selection of shortcuts if you are a beginner:
- Select all: Windows - Ctrl + A | Mac - Command + A
- Copy: Windows - Ctrl + C | Mac - Command + C
- Cut: Windows - Ctrl + X | Mac - Command + X
- Paste: Windows - Ctrl + V | Mac - Command + V
- Undo: Windows - Ctrl + Z | Mac - Command + Z
- Redo: Windows - Ctrl + Y | Mac - Command + Y
- Bold: Windows - Ctrl + B | Mac - Command + B
- Italic: Windows - Ctrl + I | Mac - Command + I
- Underline: Windows - Ctrl + U | Mac - Command + U
- Save: Windows - Ctrl + S | Mac - Command + S
- Open: Windows - Ctrl + O | Mac - Command + O
- Find: Windows - Ctrl + F | Mac - Command + F
- Replace: Windows - Ctrl + H | Mac - Command + F
- Insert/Delete row: Windows - Ctrl + Shift + + / - | Mac - Command + Shift + + / -
- Insert/Delete column: Windows - Ctrl + Shift + + / - | Mac - Command + Shift + + / -
- AutoSum: Windows - Alt + = | Mac - Command + Shift + T
- Merge cells: Windows - Ctrl + Shift + - | Mac - Command + Shift + -
- Format cells: Windows - Ctrl + 1 | Mac - Command + 1
- Hide column: Windows - Ctrl + 0 | Mac - Command + 0
- Hide row: Windows - Ctrl + 9 | Mac - Command + 9
And here are some shortcuts for more advanced users:
- Fill down: Windows - Ctrl + D | Mac - Command + D
- Fill right: Windows - Ctrl + R | Mac - Command + R
- Flash fill: Windows - Ctrl + E | Mac - Command + E
- Go to: Windows - Ctrl + G | Mac - Command + G
- Insert function: Windows - Shift + F3 | Mac - Shift + F3
- Create table: Windows - Ctrl + T | Mac - Command + T
- Name manager: Windows - Ctrl + F3 | Mac - Command + F3
- AutoFit column width: Windows - Ctrl + 0 (Zero) | Mac - Command + 0 (Zero)
- AutoFit row height: Windows - Ctrl + Shift + 0 (Zero) | Mac - Command + Shift + 0 (Zero)
- PivotTable wizard: Windows - Alt + N + V | Mac - Control + Option + Command + P
- Group/Ungroup: Windows - Shift + Alt + + / - | Mac - Shift + Command + + / -
- Paste special: Windows - Ctrl + Alt + V | Mac - Command + Control + V
- Format painter: Windows - Ctrl + Shift + C (Copy Format) / Ctrl + Shift + V (Paste Format) | Mac - Command + Option + C (Copy Format) / Command + Option + V (Paste Format)
- Spell check: Windows - F7 | Mac - Command + ; (Semicolon)
- Navigate worksheets: Windows - Ctrl + Page Up / Page Down | Mac - Control + Page Up / Page Down
- Insert hyperlink: Windows - Ctrl + K | Mac - Command + K
- Zoom in: Windows - Ctrl + Plus (+) | Mac - Command + Plus (+)
- Zoom out: Windows - Ctrl + Minus (-) | Mac - Command + Minus (-)
- Protect sheet: Windows - Alt + T + P + P | Mac - Control + Option + P + P
- Quick analysis: Windows - Ctrl + Q | Mac - Command + Q

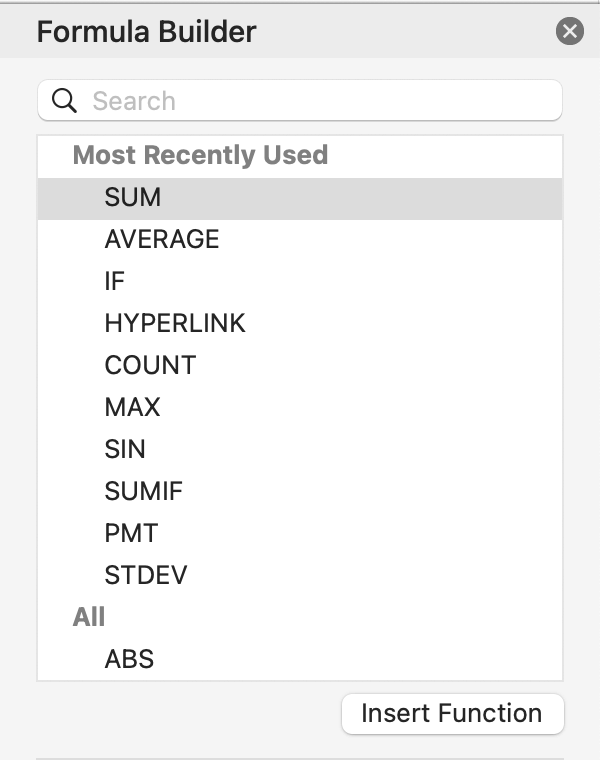
Utilize formulas and functions
Knowing formulas and functions is essential for Excel users because it allows them to perform complex calculations, manipulate data, and automate tasks. Formulas and functions enable you to analyze and gain insights from data, which makes Excel a powerful tool for data analysis and reporting.
To start learning formulas and functions as a beginner, consider the following steps:
- Understand basic mathematical operators. Familiarize yourself with the basic mathematical operators in Excel, such as addition (+), subtraction (-), multiplication (*), and division (/). These operators form the foundation of creating formulas.
- Learn commonly used functions. Begin by learning commonly used functions, such as SUM, AVERAGE, MIN, MAX, COUNT, and IF. These functions are versatile and can be used in many scenarios.
- Experiment and practice. Create sample datasets and practice applying formulas and functions to perform calculations and manipulate data. Start with simple tasks and gradually increase the complexity as you gain confidence.
- Explore function libraries. Excel offers functions categorized into different libraries, such as Mathematical, Text, Date & Time, and Statistical functions. Explore these libraries to discover new functions and their specific use cases.
- Refer to the documentation and online resources. Excel provides detailed documentation on all available functions and their syntax. Utilize Excel's built-in help system or refer to online resources, tutorials, and forums to deepen your understanding of functions and learn new ones.
- Analyze examples and templates. Analyze existing Excel examples and templates that use formulas and functions. Deconstruct these examples to understand how formulas and functions are applied and adapt them to your projects.
- Solve real-world problems. Challenge yourself by applying formulas and functions to solve real-world problems. Take on projects that require data analysis, budgeting, forecasting, or any task where Excel's computational abilities can be used.
Remember, practice and hands-on experience are crucial for mastering formulas and functions. The more you practice, the more familiar you'll become with Excel's capabilities and the better equipped you'll be.
Here's a list of basic Excel functions:
- SUM: Calculates the sum of a range of cells.
Example: =SUM(A1:A10) - AVERAGE: Calculates the average of a range of cells.
Example: =AVERAGE(A1:A10) - MAX: Returns the maximum value from a range of cells.
Example: =MAX(A1:A10) - MIN: Returns the minimum value from a range of cells.
Example: =MIN(A1:A10) - COUNT: Counts the number of cells that contain numbers within a range.
Example: =COUNT(A1:A10) - COUNTA: Counts the number of cells that are not empty within a range.
Example: =COUNTA(A1:A10) - IF: Performs a logical test and returns different values based on the result.
Example: =IF(A1>10, "Greater than 10", "Less than or equal to 10") - VLOOKUP: Searches for a value in the leftmost column of a table and returns a corresponding value from a specified column.
Example: =VLOOKUP(A1, A:B, 2, FALSE) - CONCATENATE: Joins multiple text strings into one.
Example: =CONCATENATE(A1, " ", B1) - LEFT: Extracts a specified number of characters from the beginning of a text string.
Example: =LEFT(A1, 5) - RIGHT: Extracts a specified number of characters from the end of a text string.
Example: =RIGHT(A1, 5) - LEN: Returns the number of characters in a text string.
Example: =LEN(A1) - TODAY: Returns the current date.
Example: =TODAY() - NOW: Returns the current date and time.
Example: =NOW() - ROUND: Rounds a number to a specified number of decimal places.
Example: =ROUND(A1, 2)
These basic Excel functions provide a solid foundation for performing calculations, data analysis, and manipulating text. As you become more proficient, you can explore more advanced functions to enhance your Excel skills.


Play with fonts and colors
Using fonts and colors can enhance your spreadsheets' visual appeal, readability, and organization.
Here are some ways to use fonts and colors to your benefit:
- Emphasize headings and titles. Use bold and larger font sizes to make headings and titles stand out. This helps readers quickly identify different sections and navigate through the spreadsheet.
- Categorize data with font colors. Apply font colors to categorize data or differentiate between different types of information. For example, use red font color for negative numbers, green for positive numbers, or different colors to represent different categories.
- Highlight important data with cell colors. Use cell colors to highlight important data or key insights. For example, you can apply a background color to cells containing the highest/lowest values, specific criteria, or exceptional data points to draw attention.
- Conditional formatting. Excel offers conditional formatting, allowing you to format cells automatically based on specified conditions. Use this feature to apply font colors based on specific criteria, such as highlighting cells that exceed a certain threshold, contain specific text, or meet custom rules.
- Color-coding for analysis. Apply color-coding techniques to analyze data visually. For instance, you can use a gradient color scale to represent a range of values, such as darker colors for lower values and lighter colors for higher values. This helps identify patterns, trends, and variances easily.
- Consistency and readability. Maintain consistency in font styles, sizes, and colors throughout the spreadsheet. This promotes readability and makes the spreadsheet visually appealing. Avoid using too many different fonts or colors that may create confusion.
- Use fonts for data labels in charts. When creating charts in Excel, choose clear and readable fonts for data labels, axis labels, and chart titles. Ensure that the font sizes are appropriate, allowing viewers to understand the chart data easily.
- Employ font effects sparingly. Excel provides various font effects like italics, underline, strikethrough, and shadow. Use these effects primarily to convey specific meanings or add emphasis. Overusing font effects can make the spreadsheet appear cluttered and distract from the data.
- Utilize cell styles. Excel offers pre-defined cell styles that combine fonts, colors, and other formatting options. With these styles, you can format cells based on different categories like titles, headers, totals, or specific purposes like warnings or important information.
- Consider accessibility. Ensure that the chosen font styles and colors provide sufficient contrast and are accessible to users with visual impairments.
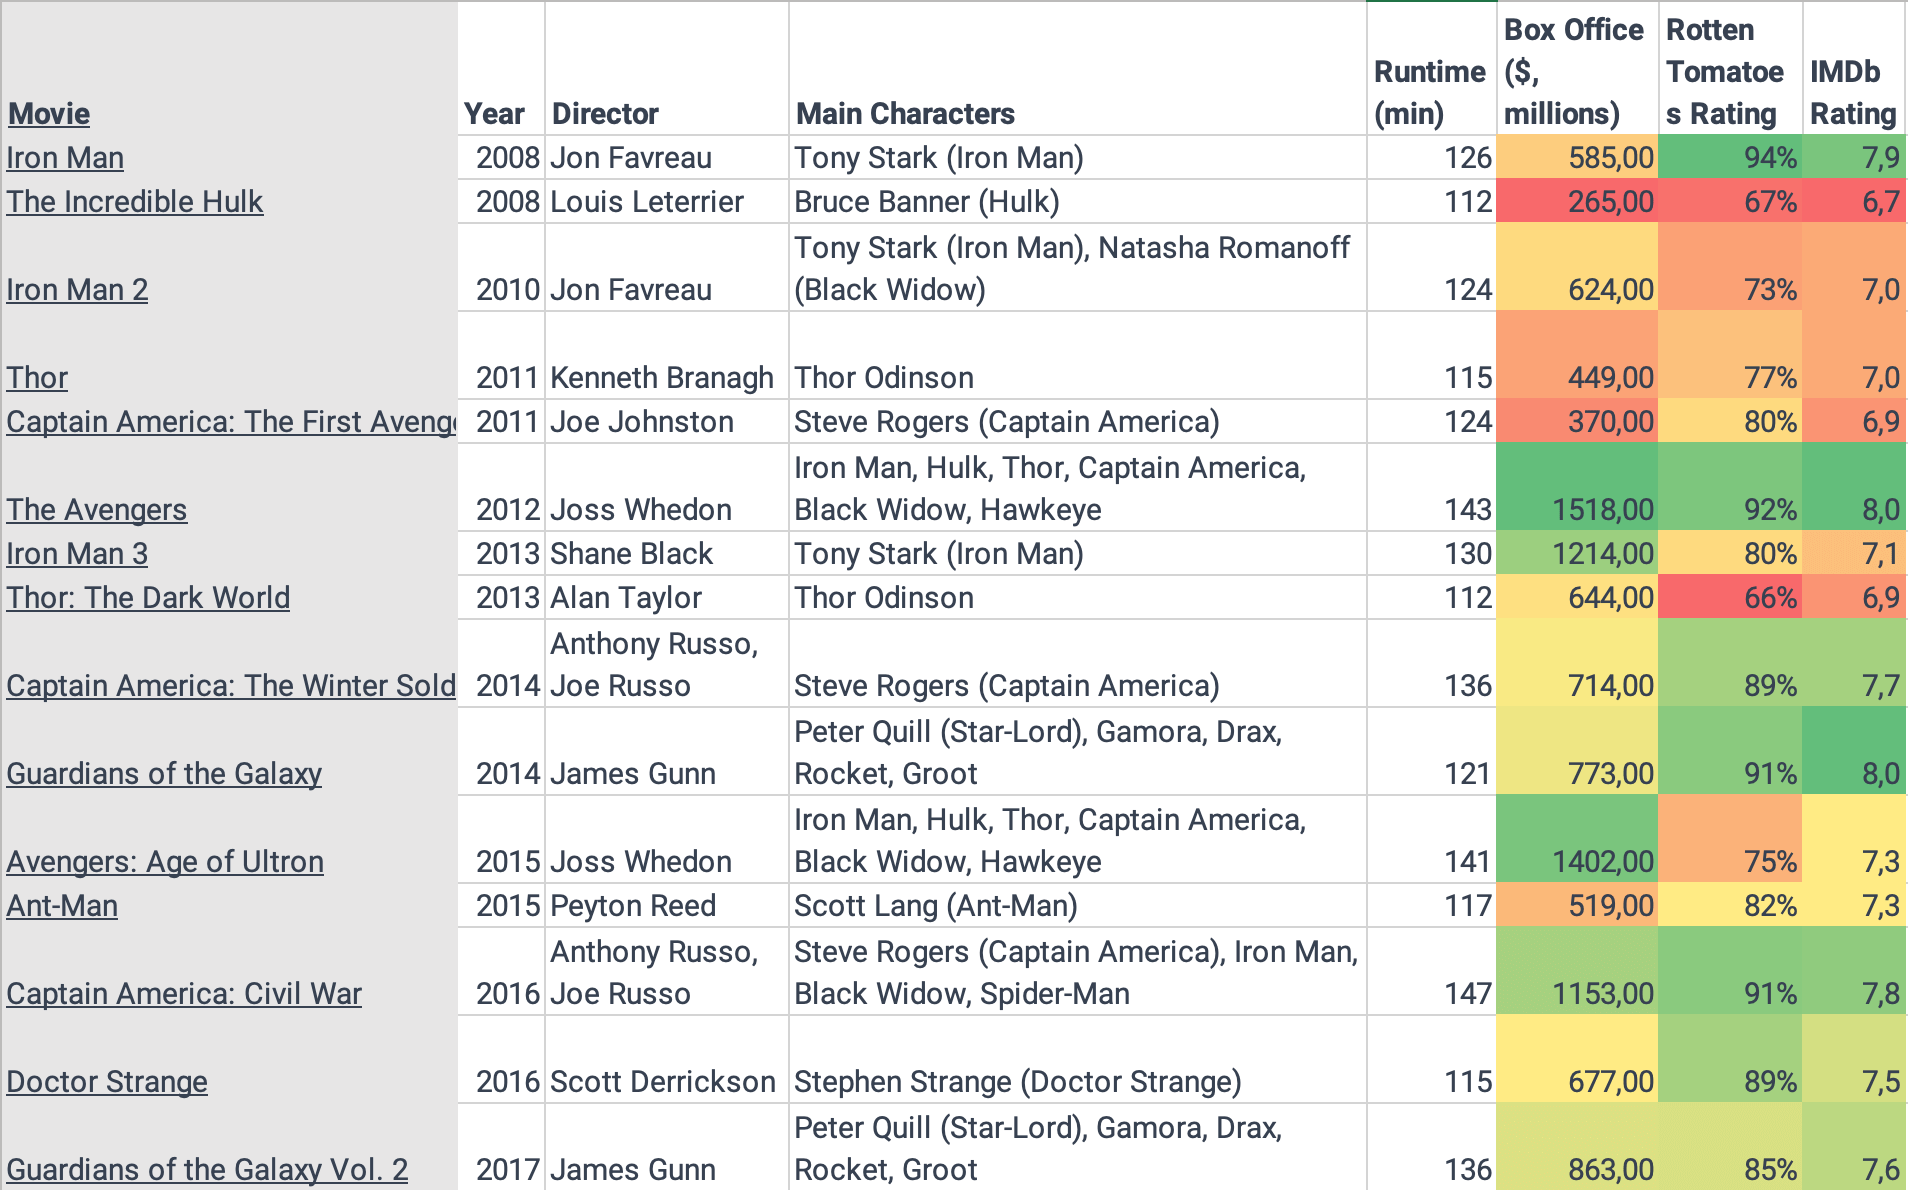
For example, here is a spreadsheet with Marvel movies that categorizes data with color according to movies’ ratings and box office:
Visualize the data
Excel offers several built-in features and tools to visualize data. Here are some ways to do it:
- Charts. Excel provides different charts, including bar charts, column charts, line charts, pie charts, and scatter plots. Select the data you want to visualize and choose an appropriate chart type based on your data and the insights you want to convey. Customize the chart elements, such as titles, labels, colors, and axes.
- Conditional formatting. Excel's conditional formatting feature can visualize data based on specific conditions. Apply color scales, data bars, and icon sets to highlight your data's patterns, trends, or variations. For example, use a color scale to show the intensity of values in a range or apply data bars to represent the relative size of data points.
- Sparklines. Sparklines are small, condensed charts that fit within a single cell. They allow you to visualize trends or patterns within a small space. Excel offers three types of sparklines: Line, Column, and Win/Loss. Insert sparklines in cells near your data to provide a quick visual representation of trends or comparisons.
- PivotTables. PivotTables are powerful tools for data analysis and visualization. They summarize large datasets and allow you to slice, dice, and analyze data from different perspectives. PivotTables can generate summary tables, cross-tabulations, and calculated fields. Use PivotCharts to visualize PivotTable data in a graphical format.
- Data bars and icon sets. Excel's conditional formatting also includes data bars and icon sets, which are visual representations of data within cells. Data bars provide horizontal bars inside cells to indicate the magnitude of values. Icon sets display icons, such as arrows or symbols, to represent the status or relative value of data points.
- Advanced charts and graphs. Excel offers additional advanced chart types, such as waterfall charts, radar charts, treemaps, and sunburst charts. These specialized chart types can effectively visualize specific types of data, hierarchies, or relationships.
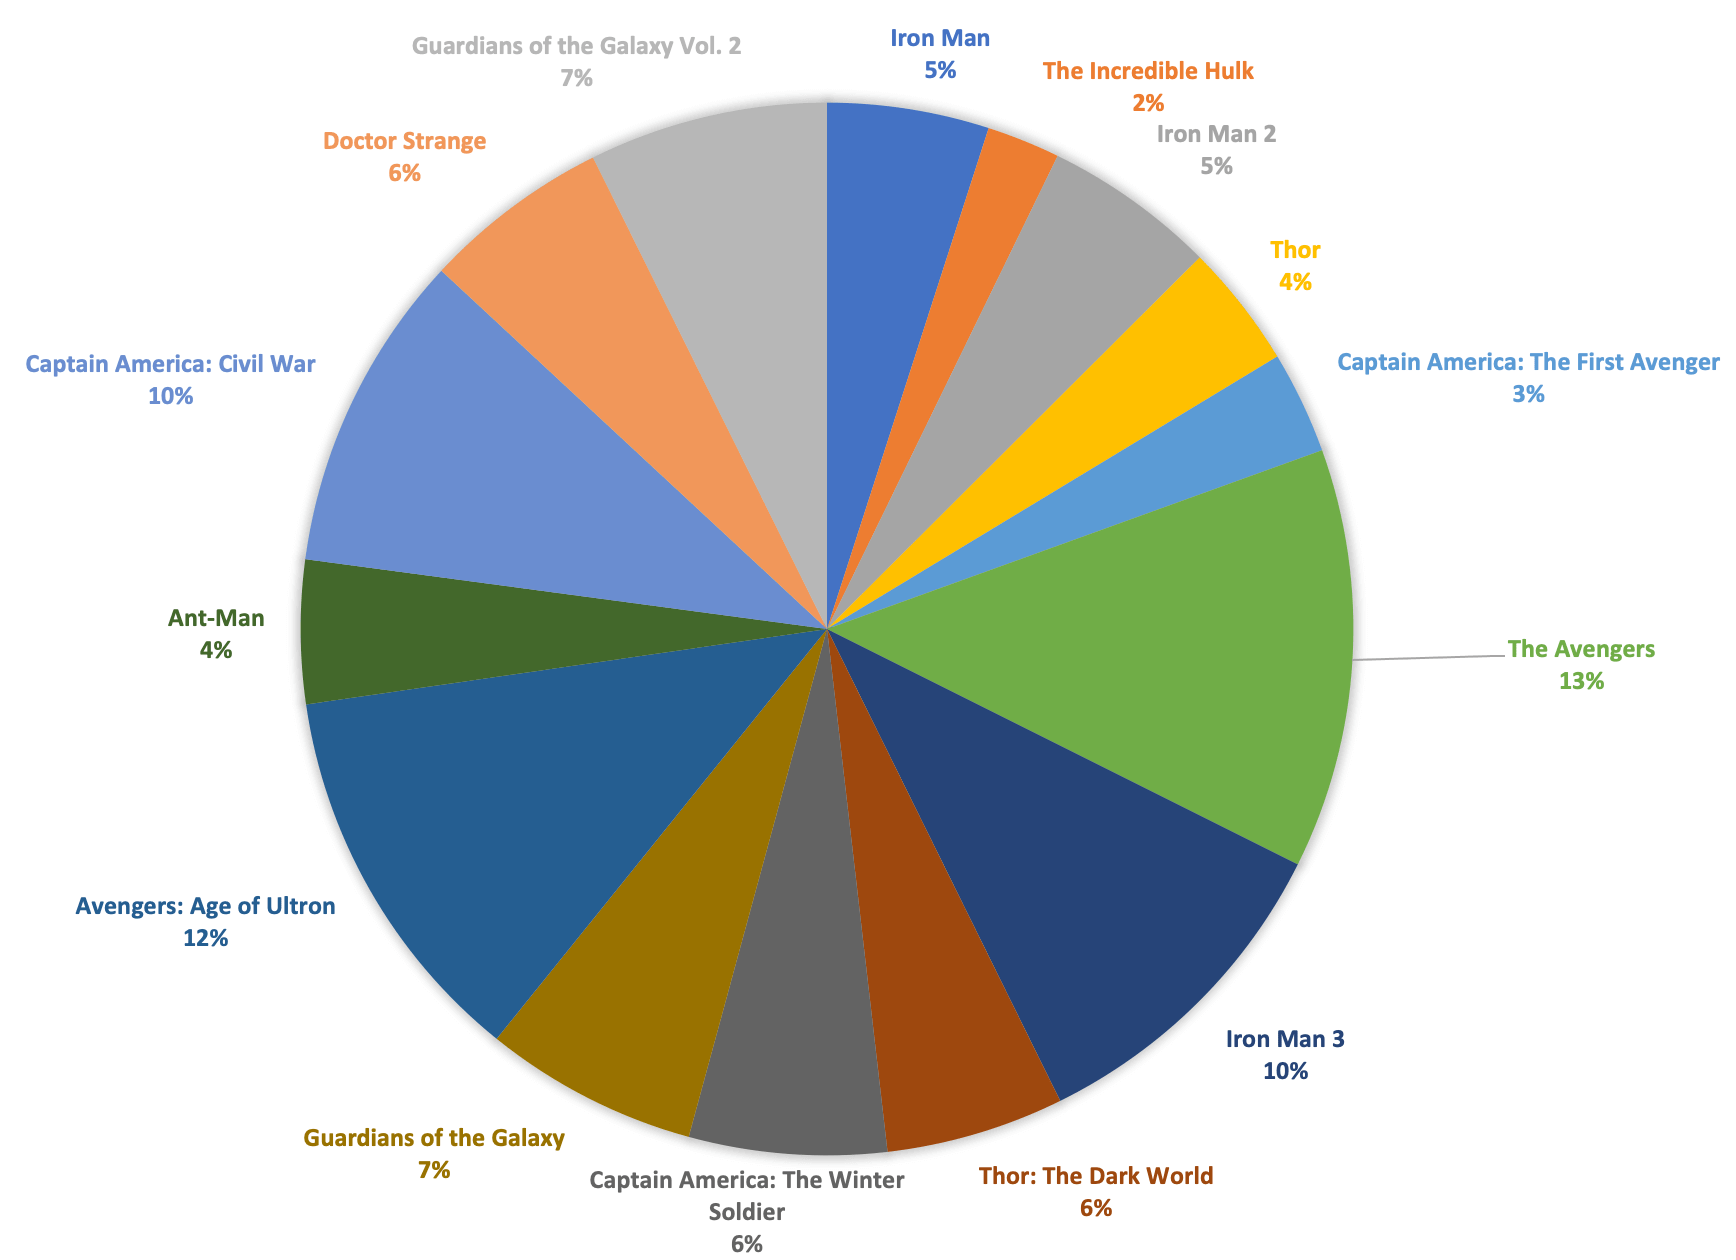
Here’s a pie chart that compares the box office of Marvel Movies:
If you prefer alternative software specifically designed for data visualization, consider tools like Tableau, Power BI, Google Data Studio, or Python libraries like Matplotlib and Seaborn. These tools offer more extensive options for visualizing data, interactive dashboards, and advanced analytics capabilities. However, remember that these software options often require a learning curve and may involve additional costs.
Extra tips&tricks
Here's a list of interesting and creative tips, tricks, and life hacks for Excel users:
- Splitting text. Use the Text to Columns feature (under the Data tab) to break a text into separate columns based on a delimiter, such as commas or spaces. This is handy when dealing with datasets that need to be separated into different columns.
- Flash fil. Excel's Flash Fill feature (Ctrl + E) can automatically fill in data patterns based on a few examples. For instance, if you have a list of full names in one column, you can type the desired format in a neighboring column (e.g., First Name Last Name) and then use Flash Fill to extract the names from the original column automatically.
- Quick calculations. The status bar at the bottom of the Excel window provides quick calculations like sum, average, count, and more for selected cells. Simply highlight the range of cells, and the results will appear in the status bar.
- Data validation. Use data validation (under the Data tab) to set rules and restrictions for data entry. This ensures users input valid and consistent data in specific cells or ranges.
- Custom number formats. Excel allows you to create custom number formats to display data in specific ways. For example, you can format numbers as fractions, percentages or use symbols like dollar signs and checkmarks.
- Grouping and outlining. Use the Group and Outline feature (under the Data tab) to collapse and expand rows or columns, making navigating and analyzing large datasets easier.
- Transposing data. The Transpose feature (under the Paste Special options) allows you to switch rows and columns, making it helpful in reorganizing data quickly.
- Freeze panes. Freeze specific rows or columns to keep them visible while scrolling through large datasets. This can be done by selecting the row or column and using the Freeze Panes feature (under the View tab).
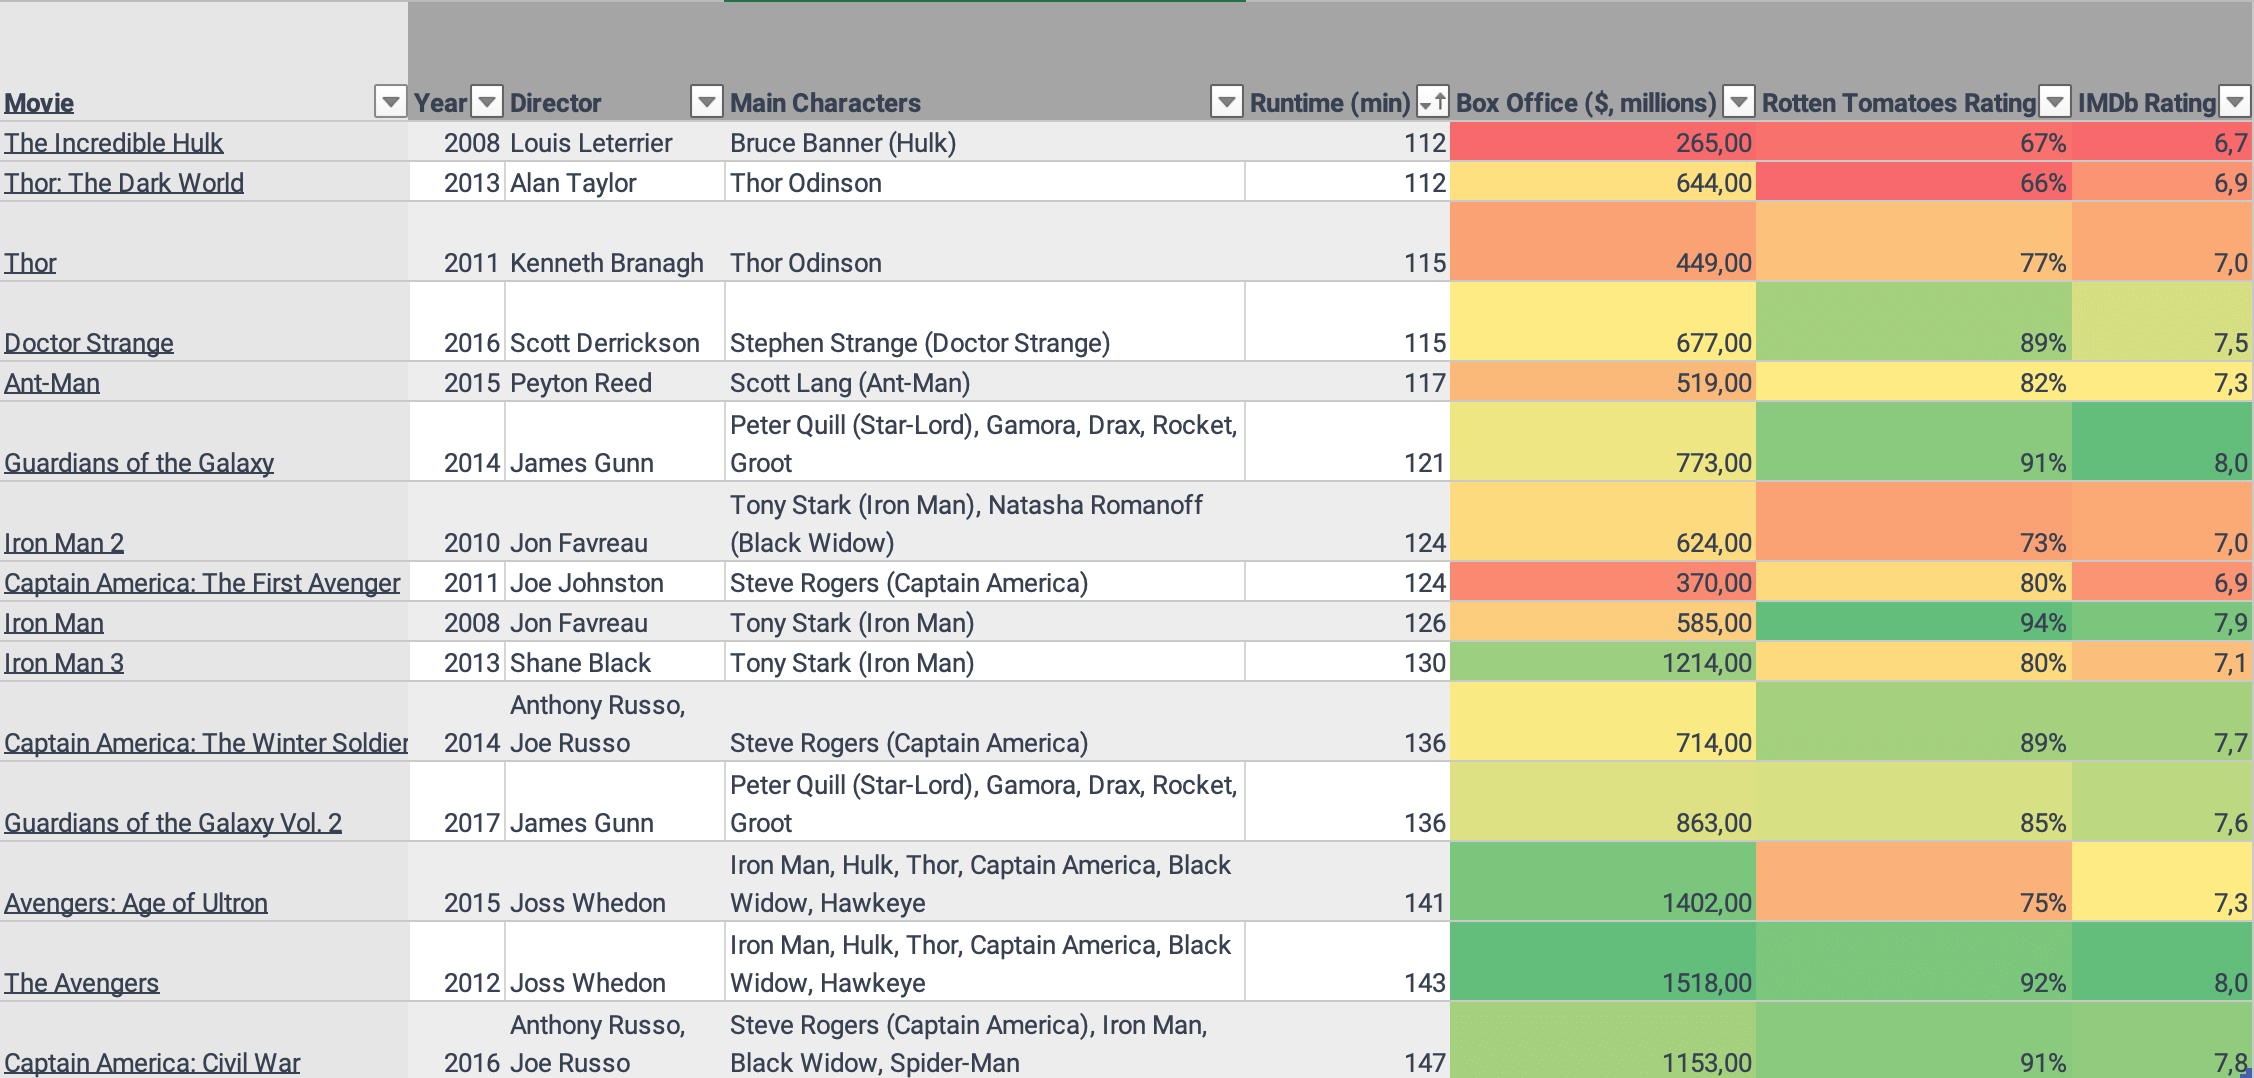
- Custom sorting. Use the custom sort feature (under the Data tab) to sort data based on specific criteria, such as sorting by cell color or a custom list.
- AutoFill options. When using the AutoFill handle in Excel, pay attention to the available AutoFill options. These options provide various ways to fill data, including fill series, copy cells, or fill formatting only.
- Protecting worksheets. Protect important worksheets by applying password protection or setting specific permissions for editing, ensuring your data remains secure.
- Data validation lists. Use data validation to create drop-down lists in cells, which helps ensure consistent data entry and makes it easier for users to select from predefined options.
Remember, the world of Excel is vast, and your potential within it is limitless. It equips you with the skills to manage data, derive insights, and make decisions. With each formula mastered, each chart created, and each analysis conducted, you gain valuable learning experience.
*ELVTR is disrupting education by putting proven industry leaders in a virtual classroom with eager rising stars. ELVTR courses offer 100% instructor driven content designed to give you practical knowledge within a convenient time frame. Choose the right course for you!