- MAIN PAGE
- – elvtr magazine – THE TOP 10 DATA ANALYSIS TOOLS FOR EFFECTIVE DATA MANAGEMENTTHE TOP 1
THE TOP 10 DATA ANALYSIS TOOLS FOR EFFECTIVE DATA MANAGEMENT
It makes perfect sense that:
“a basic understanding of how data is stored, how to query it, and how to derive insights from it is almost a prerequisite in the business context.”
Luckily, data analytics tools are also evolving at a significant rate.
You must be here because your job is to make or assist others with making data-driven decisions. If you’re also willing to explore options in terms of available technology to support your endeavors, you’ve come to the right place.
This article will shine some light on:
- How to choose the right tools for data analysis
- Key questions to answer before deciding on the data analysis tool
- 10 best tools for data analysis
- Bonus recommendations
How to choose the right tools for data analysis
Here are 8 details to bear in mind before making a verdict:
-
Business goals
As with any type of investment, your choice of analytics platform should be aligned with your business objectives. Self-analysis is always a good starting point before taking a step in a new direction. It comes down to knowing where you are, where you want to go, and how you will get there. First, you should recognize your main business goals and rate how your current data analysis setup helps you accomplish those goals. Most likely, you will immediately notice room for improvement. This will allow you to connect your primary business goals to measurable analytics targets. Finally, the knowledge accumulated in such a process will help you choose exactly the right platform.
-
Cost
However, the right platform doesn’t always have to have exactly the right price. Money out of your (company’s) pocket is an obvious factor to consider, which is why it’s so high on the list. Ergo, familiarize yourself with the costs behind your data analysis solutions. Understand their plans, subscription models, and hidden fees.
-
Integration possibilities
Are you aiming for flexibility, or it’s not that important? Some data analysis systems can be independent and uncooperative with other applications, and some can connect to existing and third-party sources (e.g., Tableau). Depending on your position and needs, integration-or-not should be a fairly easy riddle to solve.
-
Mobility
Once again, do you need simple data analysis software, or do you want to use it on your feet? Mobility is critical for globally oriented companies or those with remotely dispersed teams. Mobile applications can facilitate access, accelerate response time, and improve internal communication if you need information on the go.
-
Agility and Scalability
How far are you willing or need to go? Can you already predict that what you need today will not equal what you need in a year? Then you should search for a solution that can organically grow along with your business and data. Such analysis tools are cloud-based and designed to start small and develop together with your business. These systems ensure a competitive advantage and allow you to be ready when it’s time for hyper-growth.
-
Multiple Sources Of Data
Today’s analysis tools can combine multiple complex data sources, including structured, semi-structured, and unstructured data. However, increased functionality demands higher skills to operate any given instrument. So beware not to opt for a heavy system that requires your IT department assistance if that’s out of your reach. Nevertheless, being able to pull data from different sources back to a single dashboard provides a complete view of your business performance.
-
Collaboration options
Do you have a team of data analysts or need to grant access to other colleagues and third parties? Then your tool of choice should ideally allow users to share, analyze and interact with data. Such a platform goes a long way in enabling smarter and cooperative decision-making.
-
Safety and security
Collaboration, however, does not come without the risks of information loss, leakage, or misinterpretation. This is especially the case for mobile applications, as users access the data outside their security net. It calls for measures of precaution.
Suggestions:
- Learn about standard security controls and procedures at all levels.
- Evaluate the security level of your provider and make sure your data will be properly protected.
- Be able to control precisely which users or groups can access which data.
Key questions to answer when deciding on the data analysis tool:
- Where does my data come from (third-party applications, devices, server logs, transactions, social media)?
- How does my data arrive (batches, flows)?
- How fast must my system process new data in reports?
- How much data can I afford to process and store?
- How will I manage spikes in data volume and queries?
- Is there a culture present at the company level that encourages data-driven decision-making?
- Who should have access to the analytics platform, and what tools and skills do they need?
Answering these questions will further refine the idea of what you need and can maintain.
10 best tools for data analysis
Excel
The leading spreadsheet and data analysis software bundled with Microsoft Office.
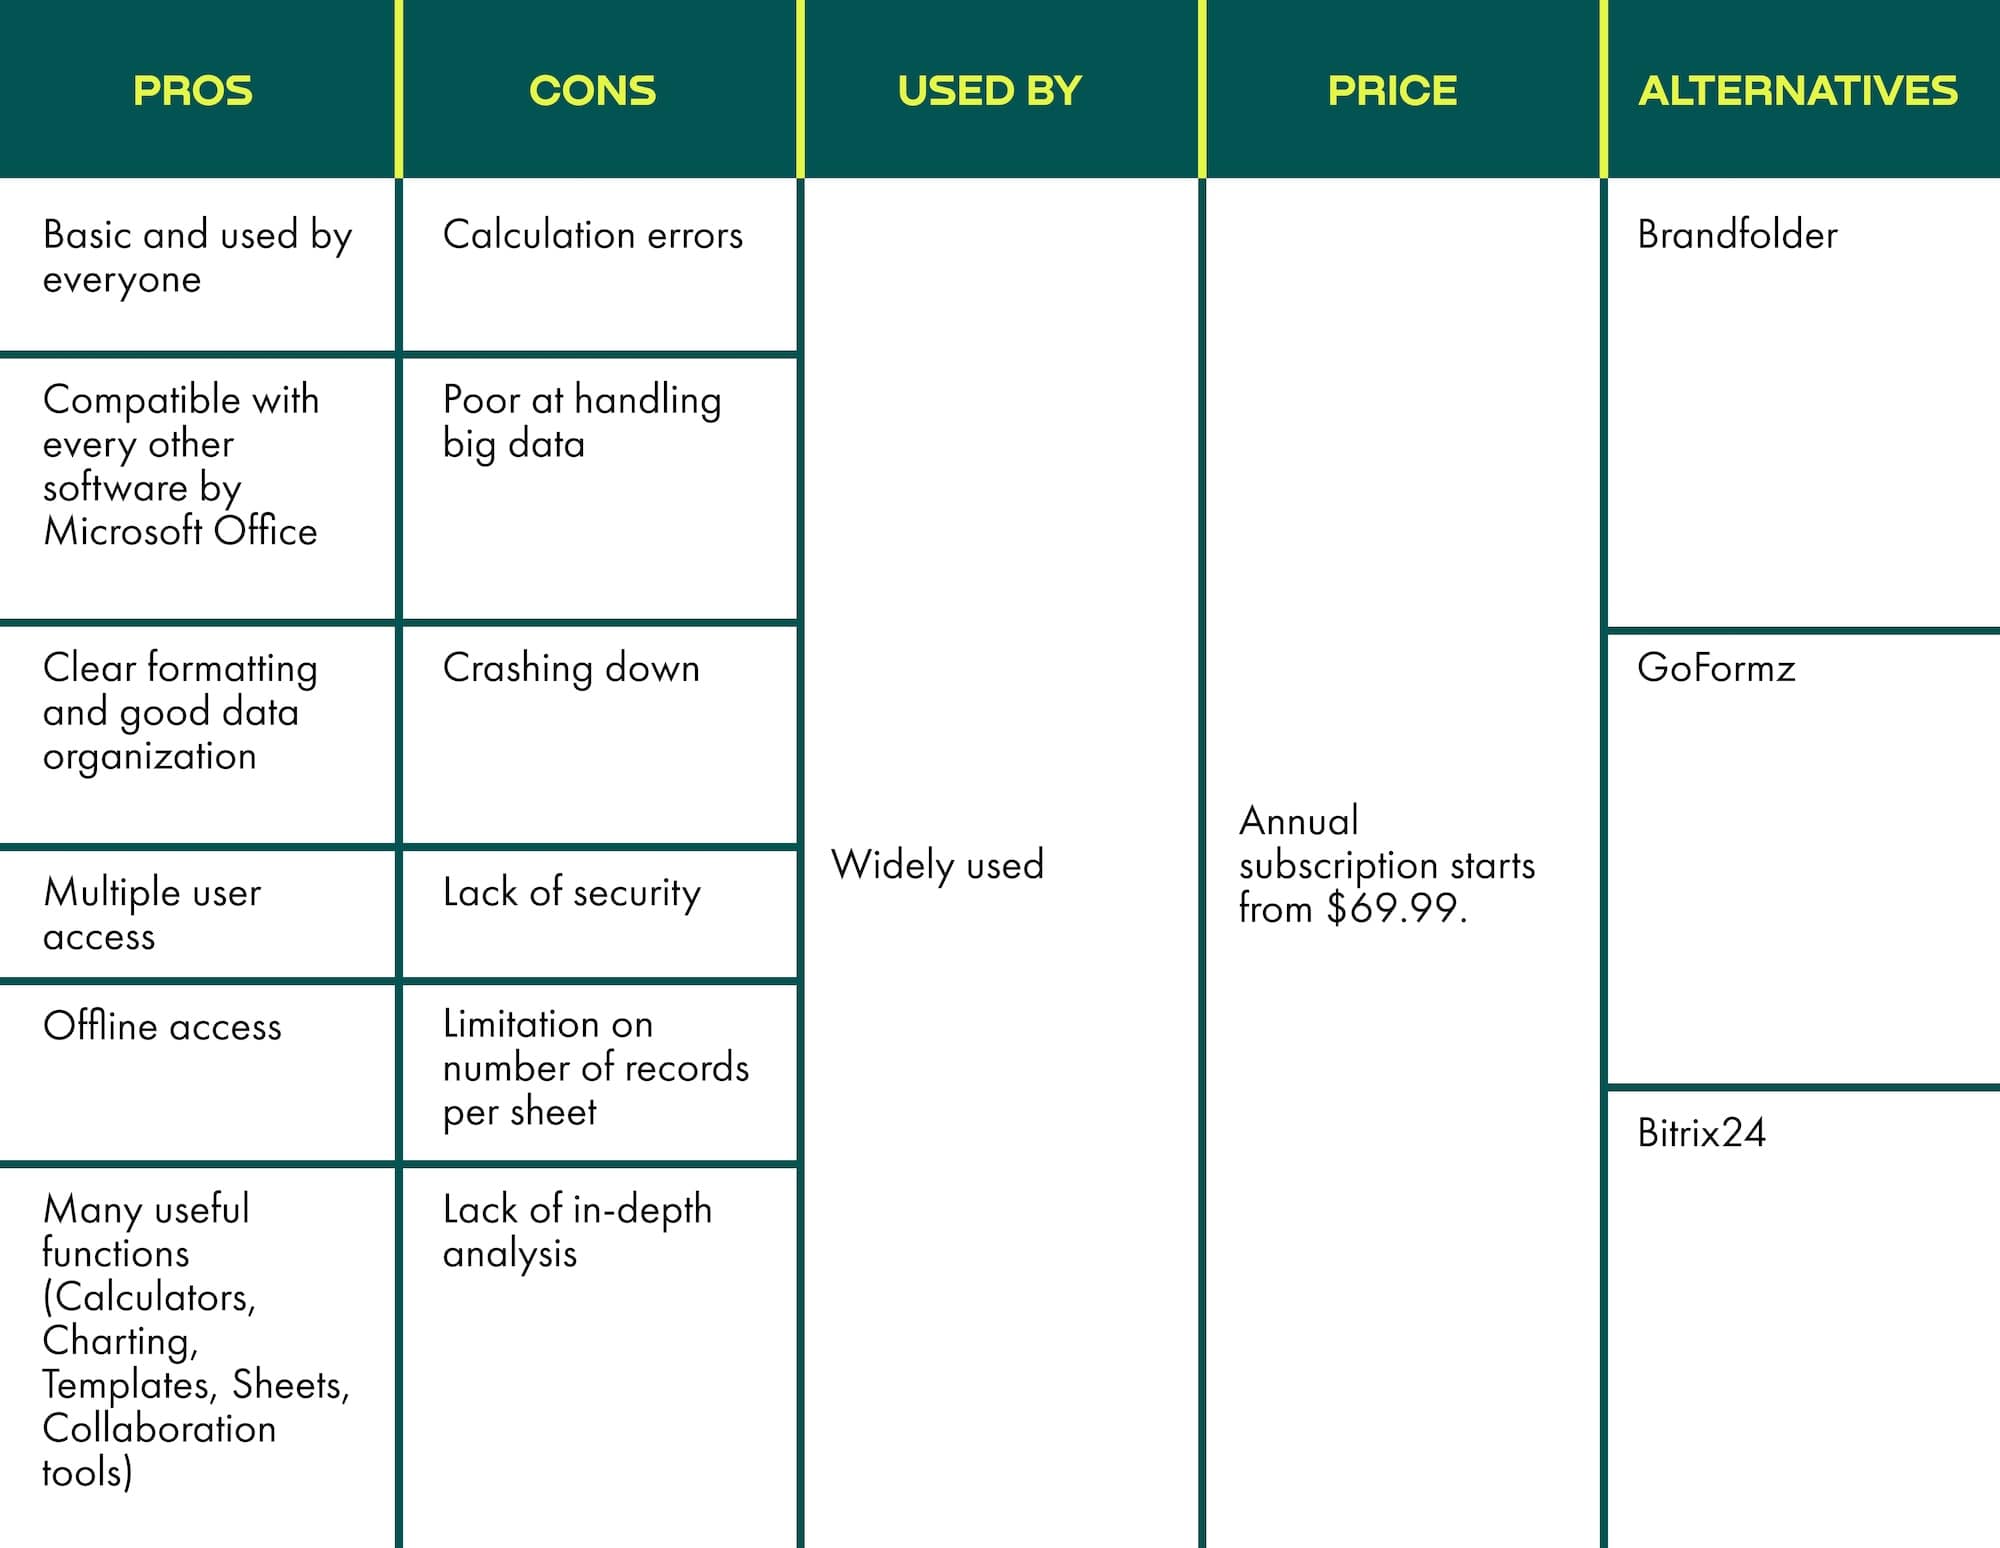
Microsoft Excel is a well-known tool for data organization and analysis. Compared to other more complex systems, it is pretty simple and not without limitations. However, it can still bear almost any basic analytical calculations and be “upgraded” by a different set of add-ons. On the other hand, it is not suitable for large amounts of data, so that’s a very self-explanatory heads-up. Depending on the scale of your data and business, it might be the only solution you need, and then again – it might very well not. There will always be things to use it for. Still, if you’re dealing with big data, you will have to consider modern cloud-based analytics platforms for extensive and collaborative analyses.


Microsoft Power BI
The suite of business intelligence and analytics with reporting, data prep, and data visualization tools.
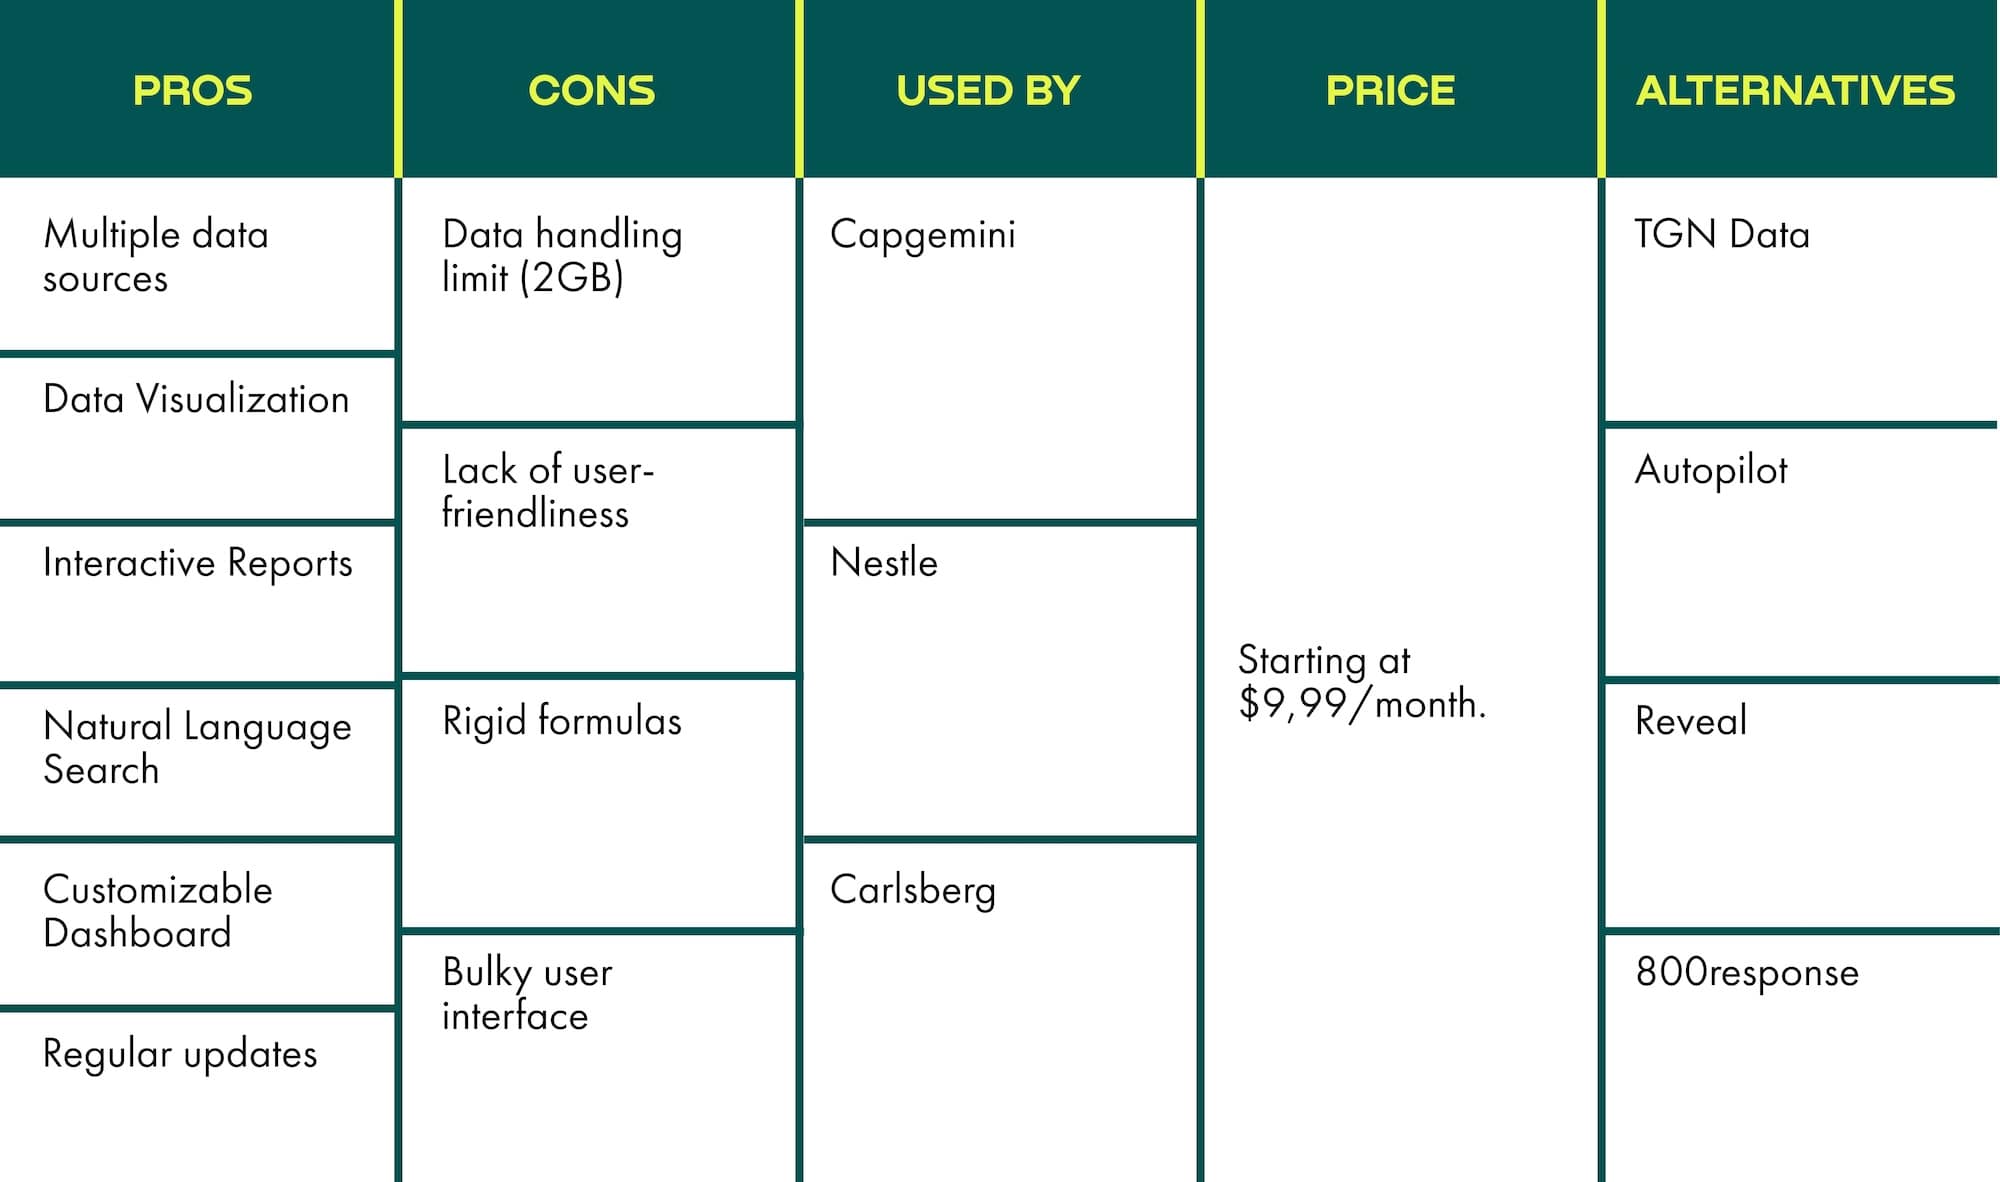
Microsoft Power BI is a data analytics tool that originated from Excel as one of its plug-ins. It goes without saying then those two are very compatible. This tool can also seamlessly retrieve data from cloud sources, social media analytics, or simple text files. Furthermore, a user can create datasets, dashboards, and reports in a basic version and share them with coworkers for their own independent analysis. If everyone needs access to the same files simultaneously, there is a cloud-based option for a monthly fee of $9,99.
Moreover, data visualization seems like the next level compared to Excel. On the downside, the user interface lacks more native scrolling options, while sidebars often block the view from what’s important. Likewise, there are problems like rigid formulas and low data handling limit. Still, if you need an upgrade from Excel, this is your tool.
Tableau
The rapidly growing visualization tool used for different business applications.
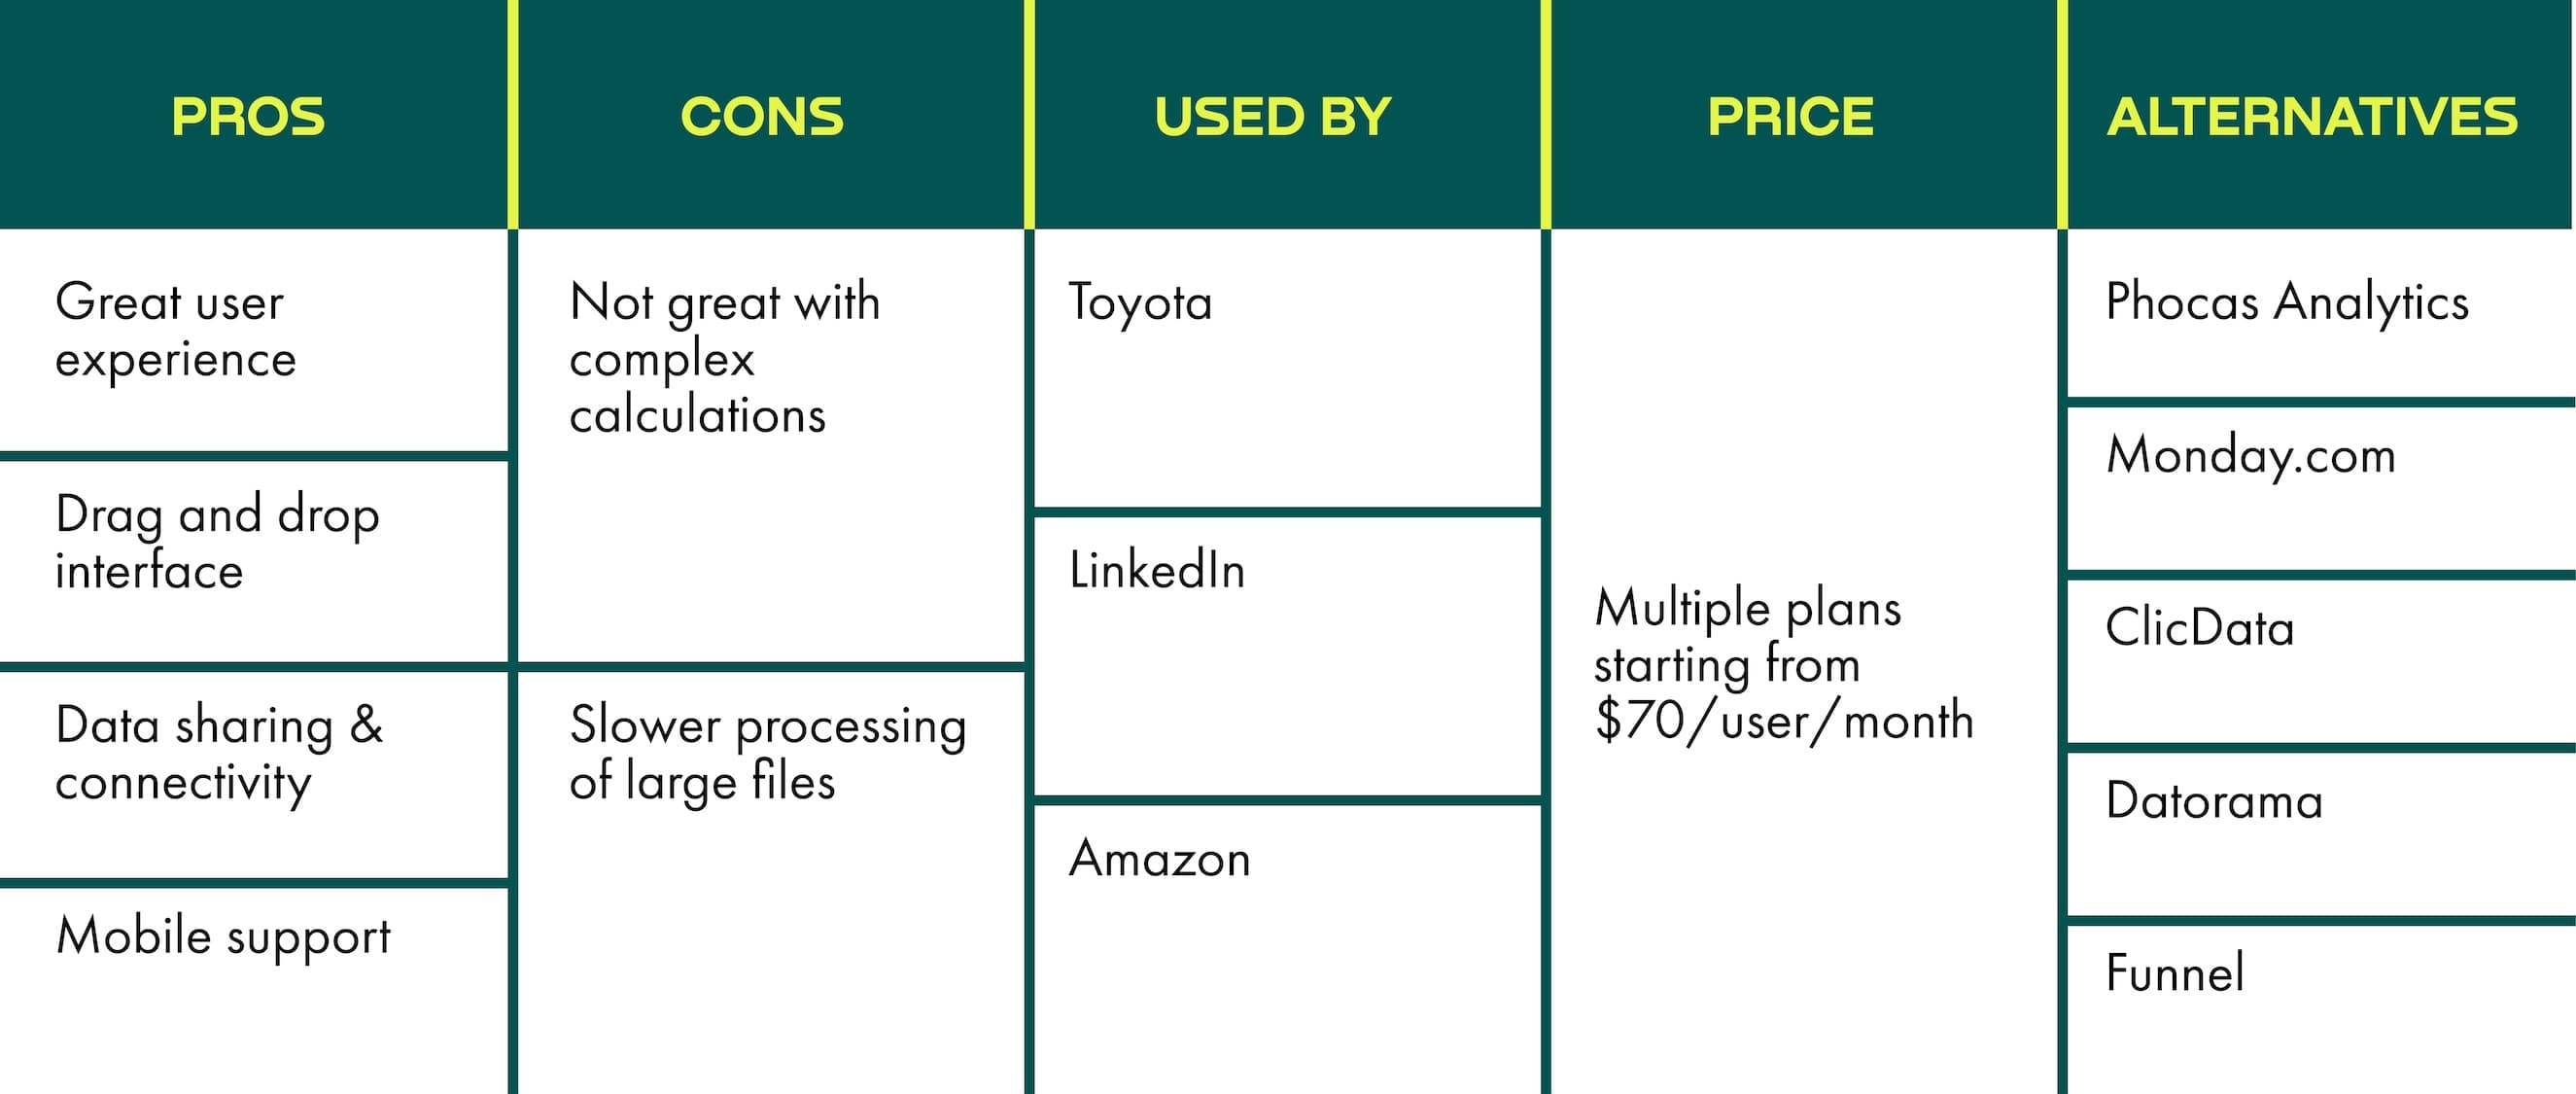
Tableau is a data analytics tool that allows you to create interactive visualizations and transform them into actionable insights. An extremely friendly drag and drop interface makes its usage an absolute pleasure. This further enables users to discover trends in data fairly easily. It’s a highly collaborative tool that allows everyone within an organization to stay connected and up to date. However, it’s not without shortcomings. Some of those are challenging implementation, poor data pre-processing, heavy calculations, and low affordability for smaller companies.
KNIME (Konstanz Information Miner)
The cloud-based solution that provides businesses with tools to configure data science workflows using predictive analytics.
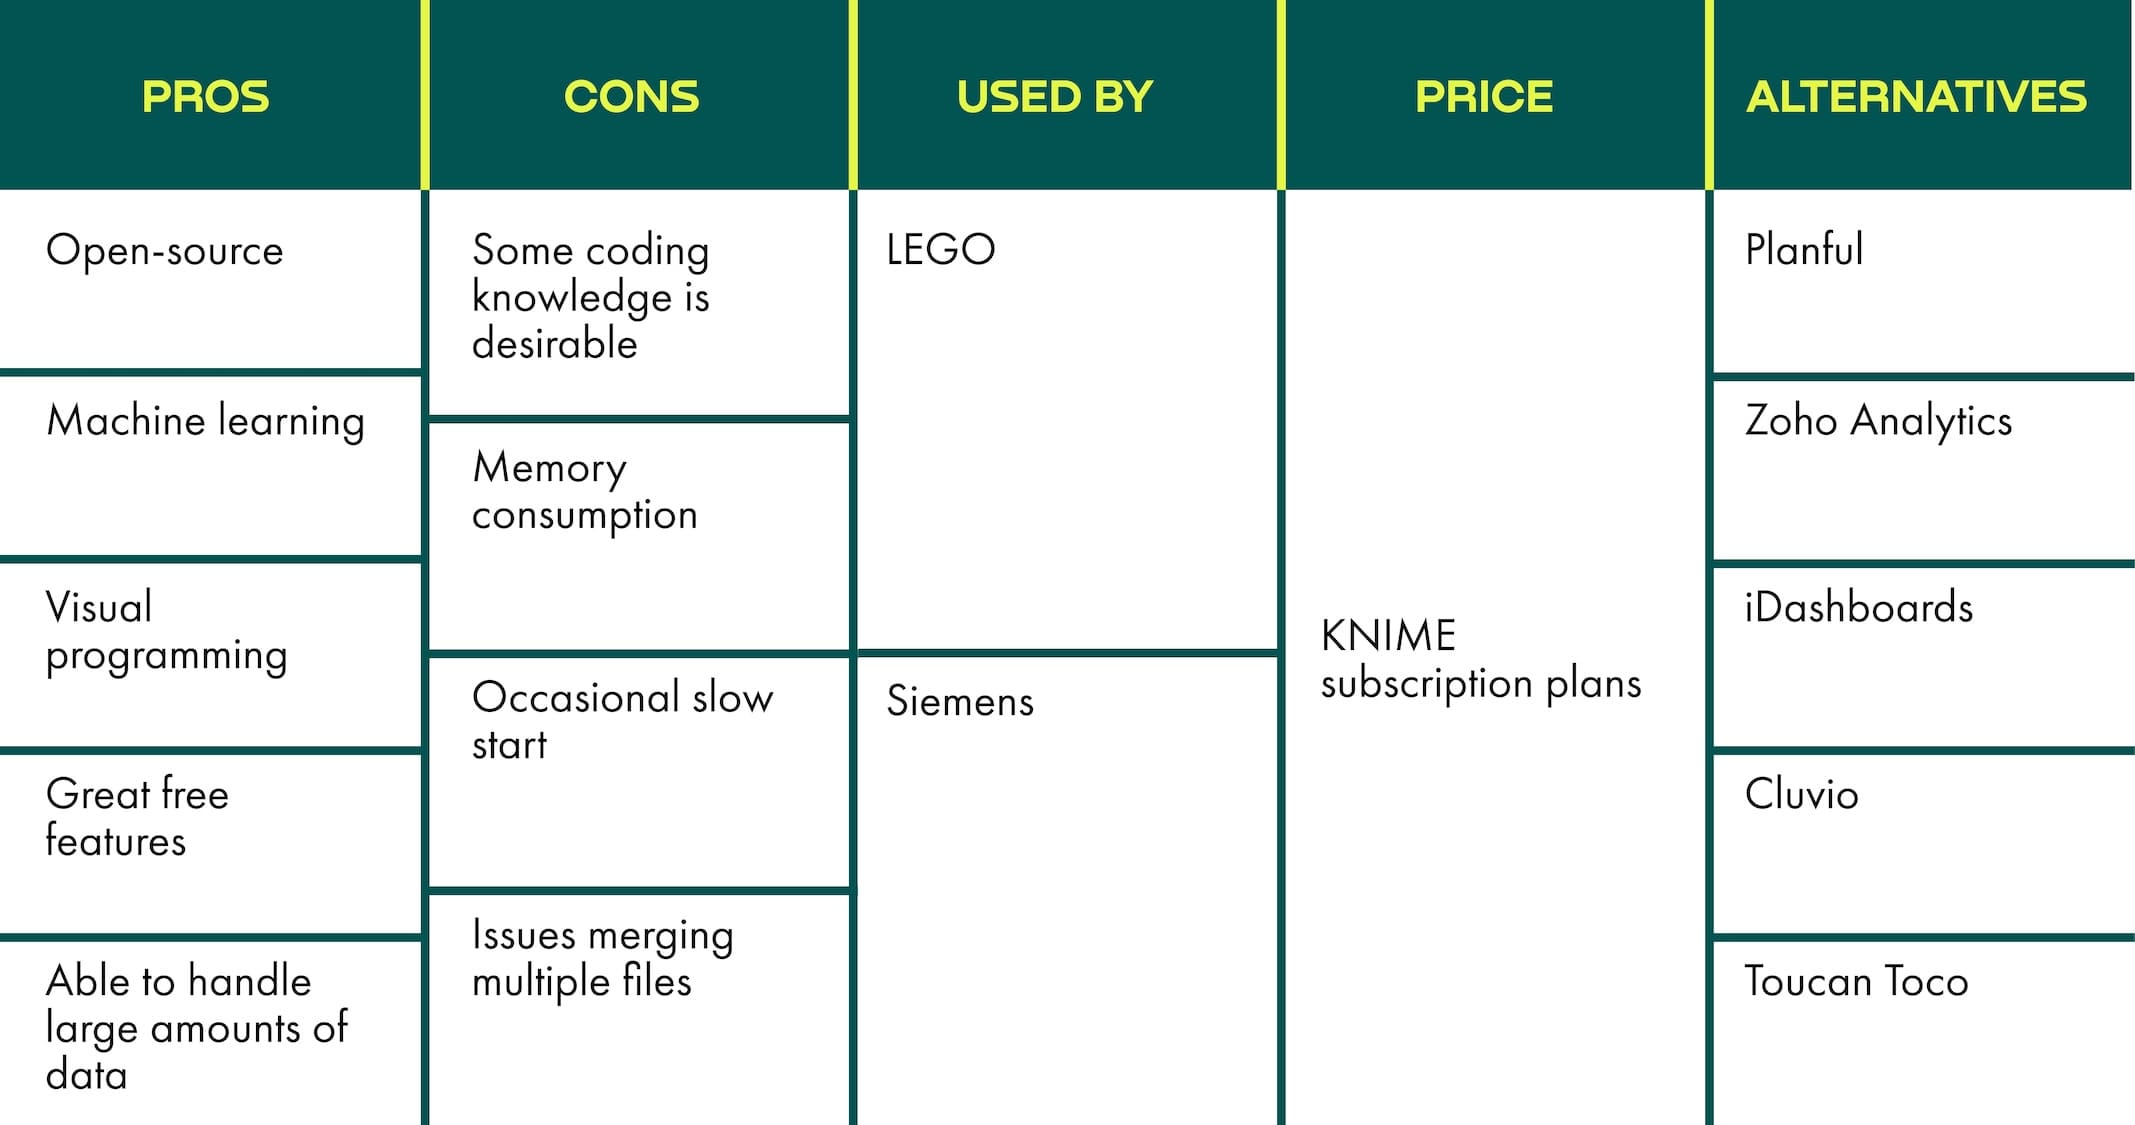
KNIME is a cloud-based, open-source data integration platform. In essence, this means it can retrieve information from many different sources with great possibilities for integration, transformation, and visualization of data. KNIME is also great in predictive analytics, database administration, data import/export, and user collaboration. Some notable drawbacks include high memory consumption, occasional slow starting speed, and degree of coding skills being useful for users.
Jupyter Notebook
The open-source application that allows businesses to create documents with live codes, equations, visualizations, and narrative text.
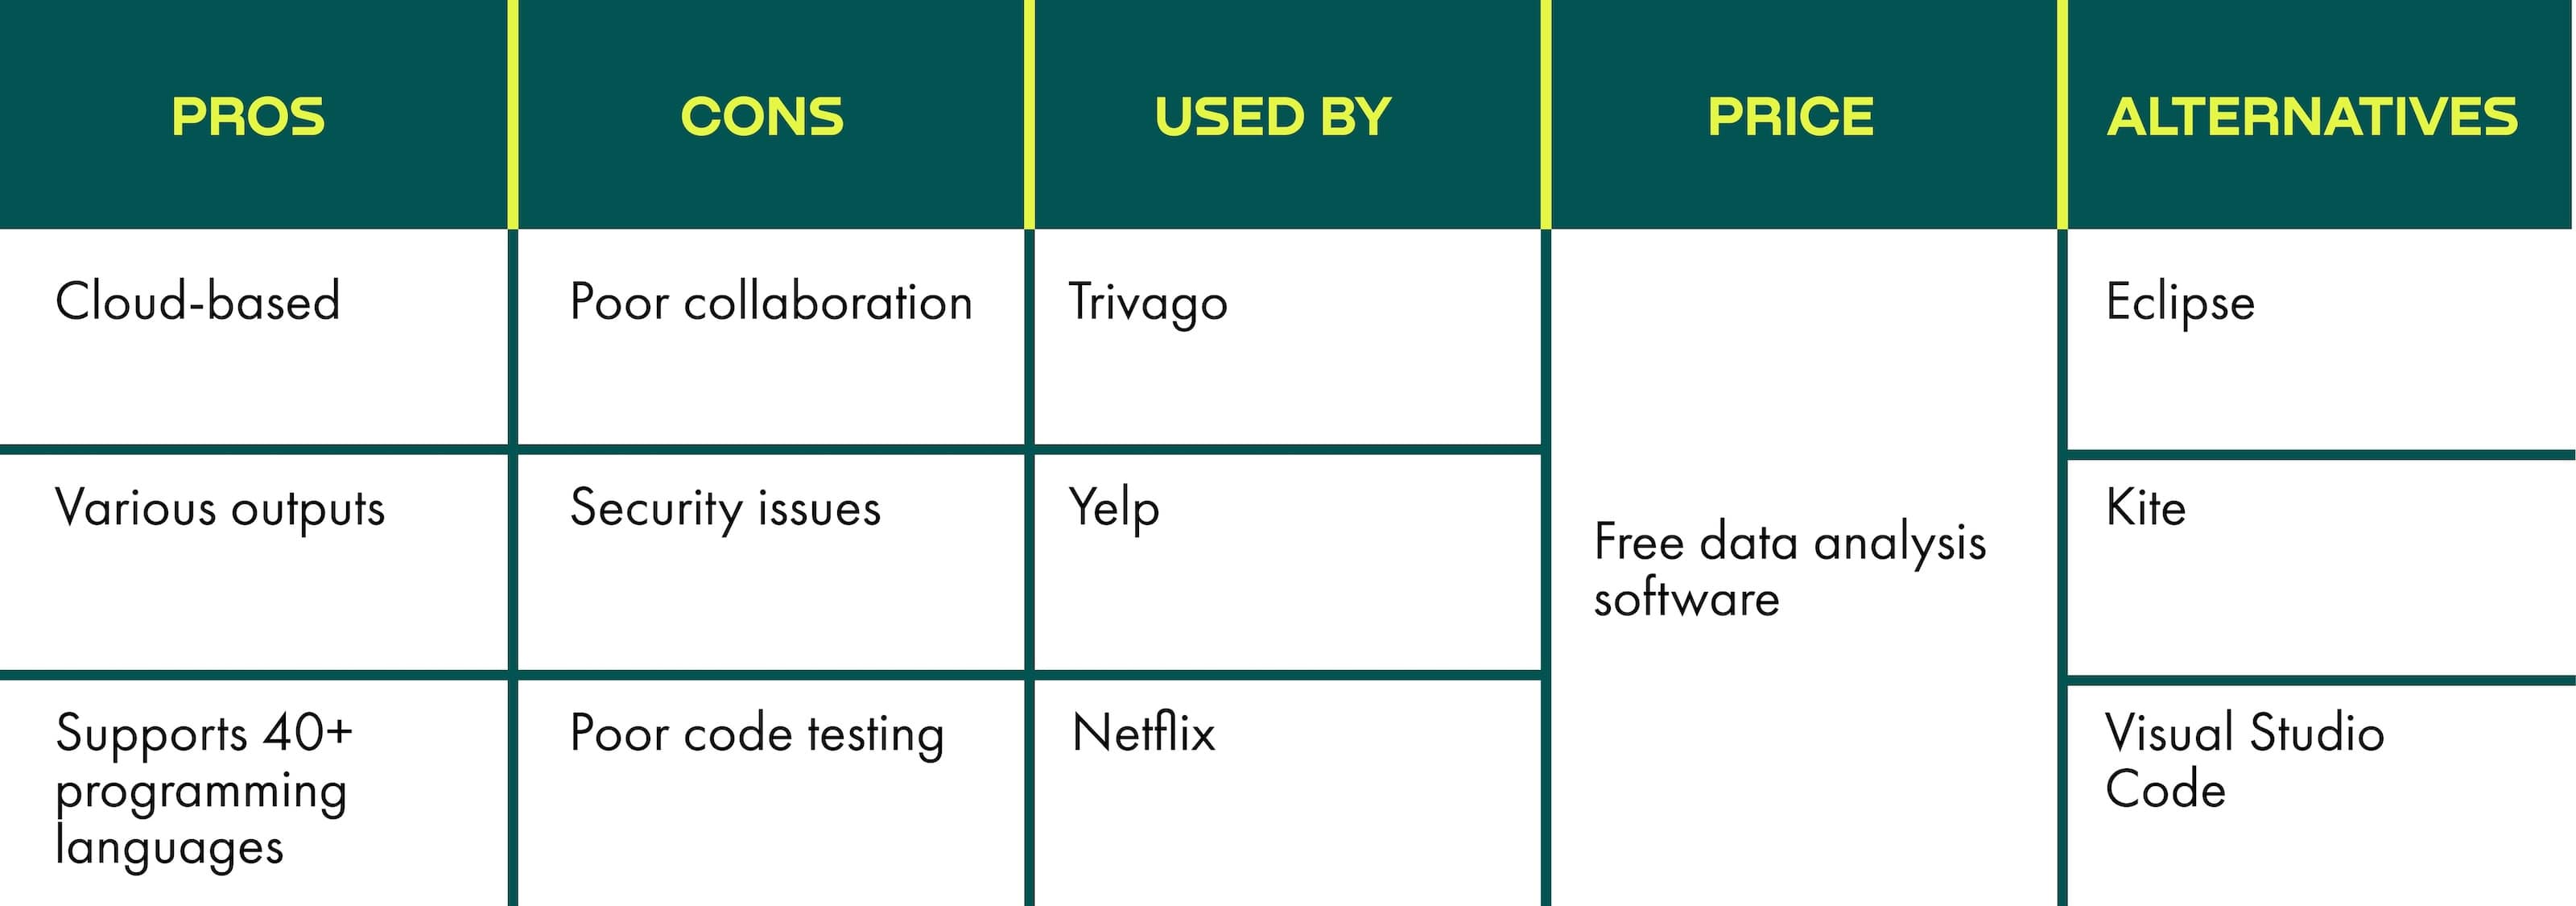
In essence, Jupyter Notebook is an open-source project that allows users to create books and documents from computational material. It can perform actions like data cleaning and transformation, numerical simulation, statistical modeling, data visualization, machine learning, and much more. Within it, you can use more than 40 coding languages and produce outputs in many different formats. If it sounds like your game, here’s a step-by-step guide on its functions and abilities.
Qlik
The data software which specializes in data visualization, executive dashboards, and self-service BI.
Qlik is another great platform ensuring value for business insights. It operates both on the cloud and locally and allows for customization of charts with embedded SQL or drag-and-drop modules. The self-service data analytics that it provides is characterized by:
- simple-to-use BI tools
- no need for top-level analytic capabilities
- simplified and easy to understand the data model
- straightforward data access
R
The open-source programming language and computing environment with a focus on statistics and graphical data visualization.
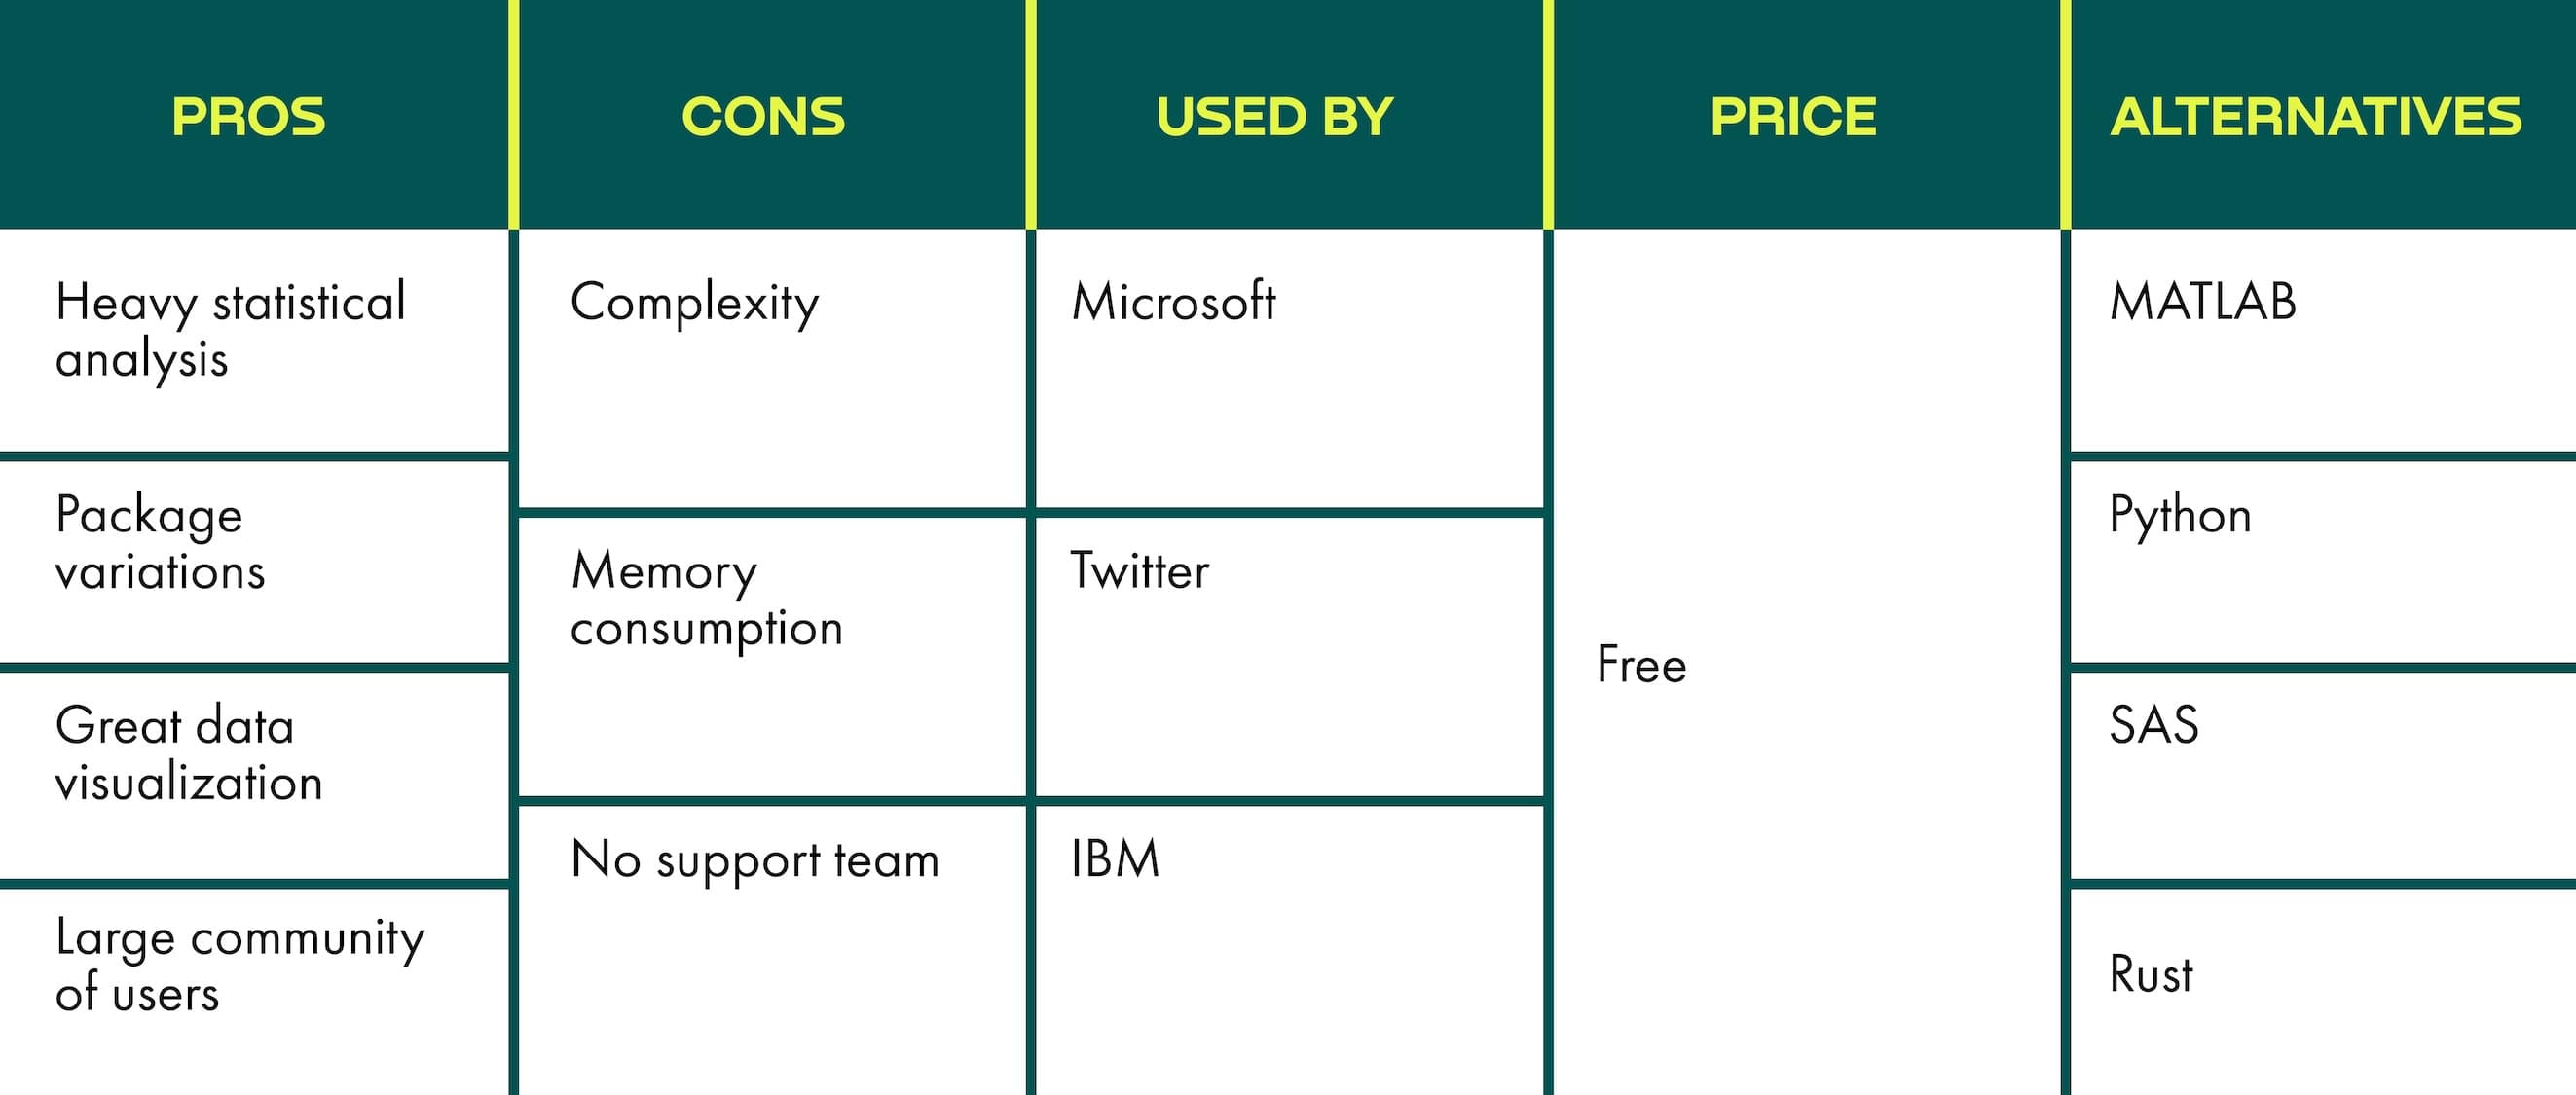
R is a software environment and a coding language popular in the area of data science and analysis. It was designed for serious statistical analysis, and it can deliver great data visualization. The big plus is that it integrates with many other languages and systems, including C, C++, FORTRAN, etc. Also, analysts with coding skills can build almost any type of data analysis with R. However, users without such a background could find it too complex.
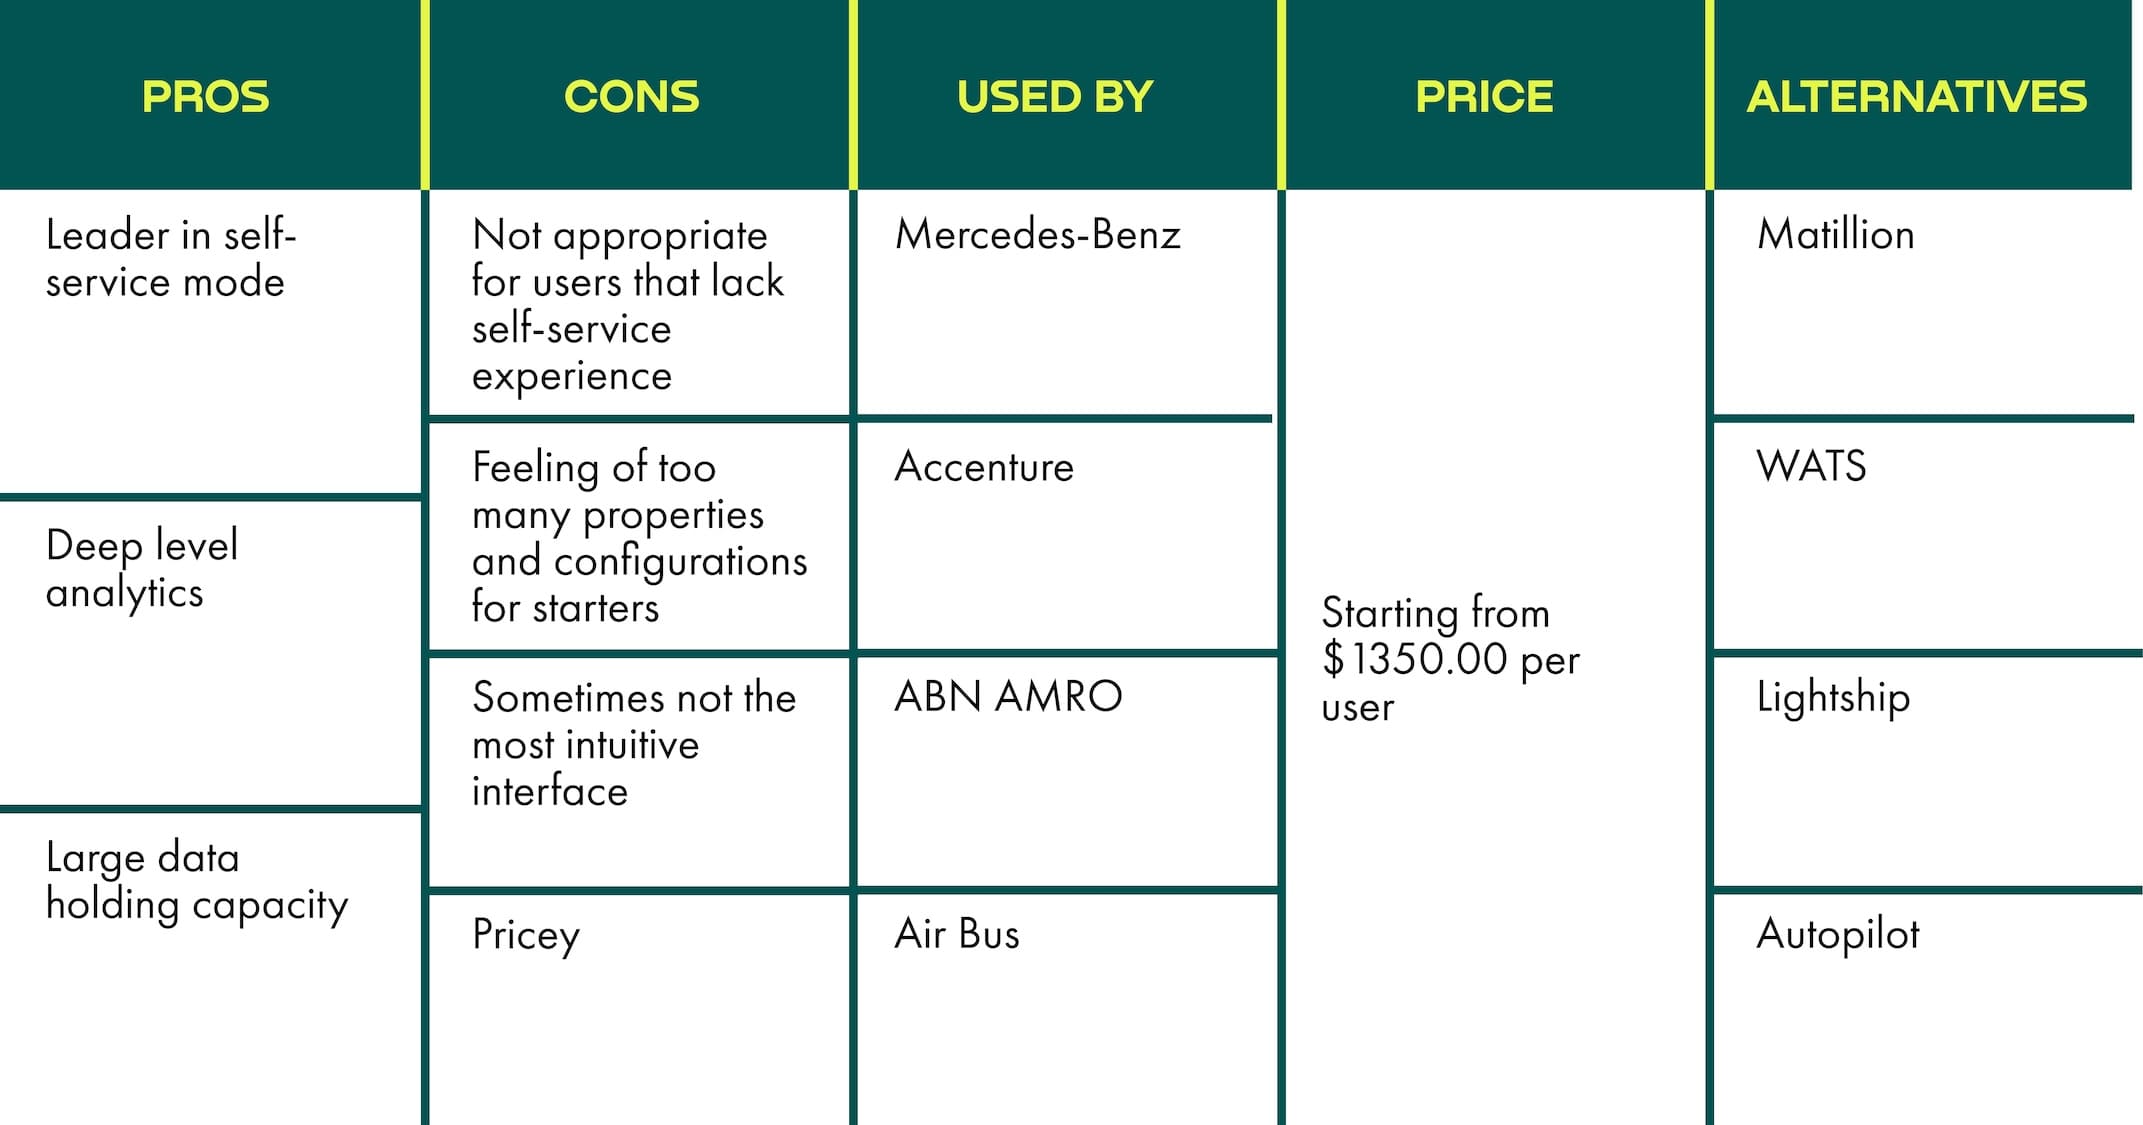
SAP BusinessObjects
The suite of business intelligence applications for data discovery, analysis, and reporting.
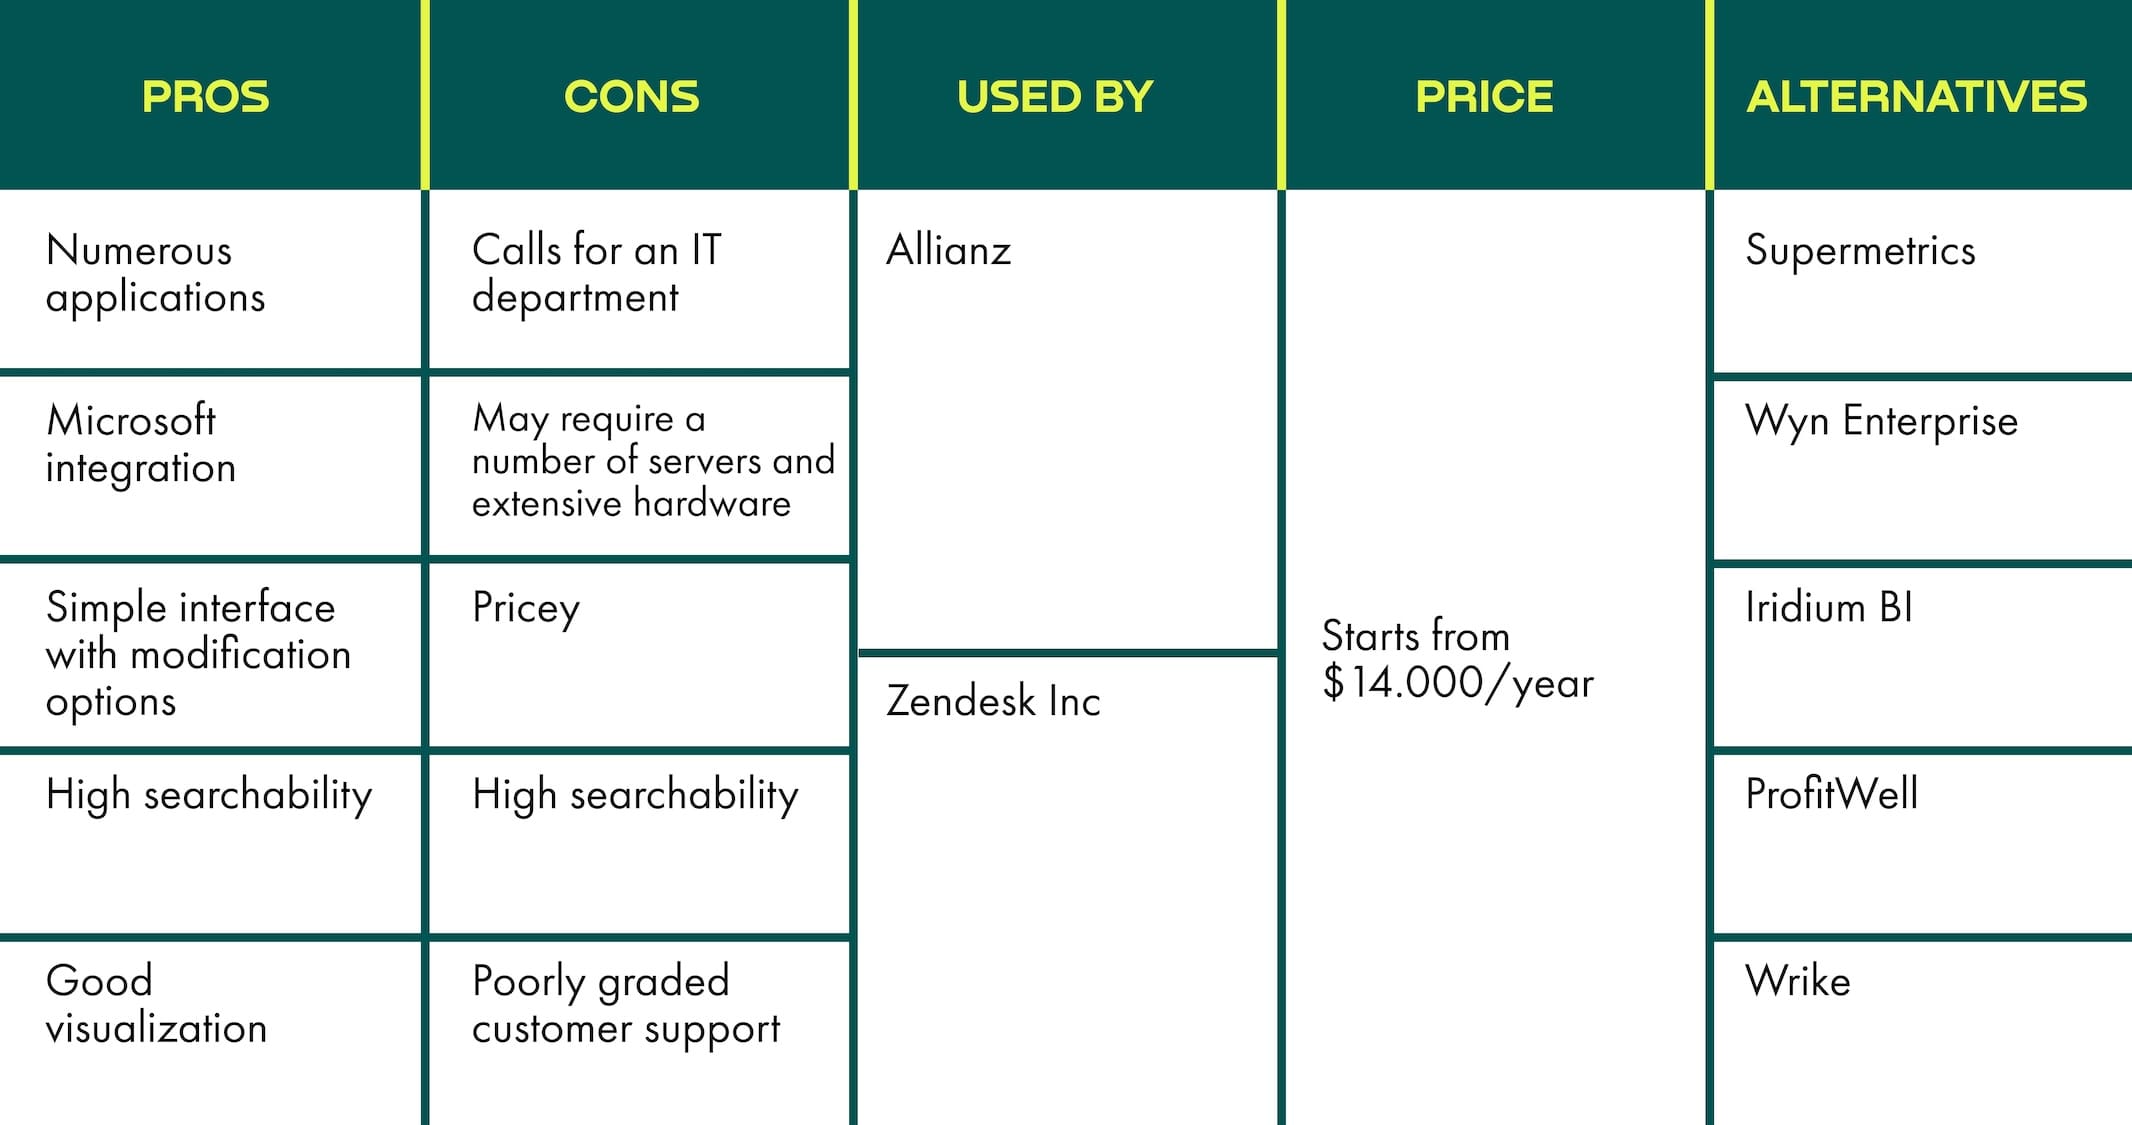
SAP BusinessObjects offers a variety of business insight functions from reporting, discovery to detailed technical self-service analysis. Top professionals can use it to perform complex data analysis. It allows quick searches through large piles of data and provides exceptional visualizations. The significant advantage comes from being well integrated with the Microsoft Office suite, allowing a seamless transition between the two. Also, it contains several reporting and analysis applications, each having a different purpose and function.
Sisense
The platform for data processing and visualization with interactive and collaborative dashboards.
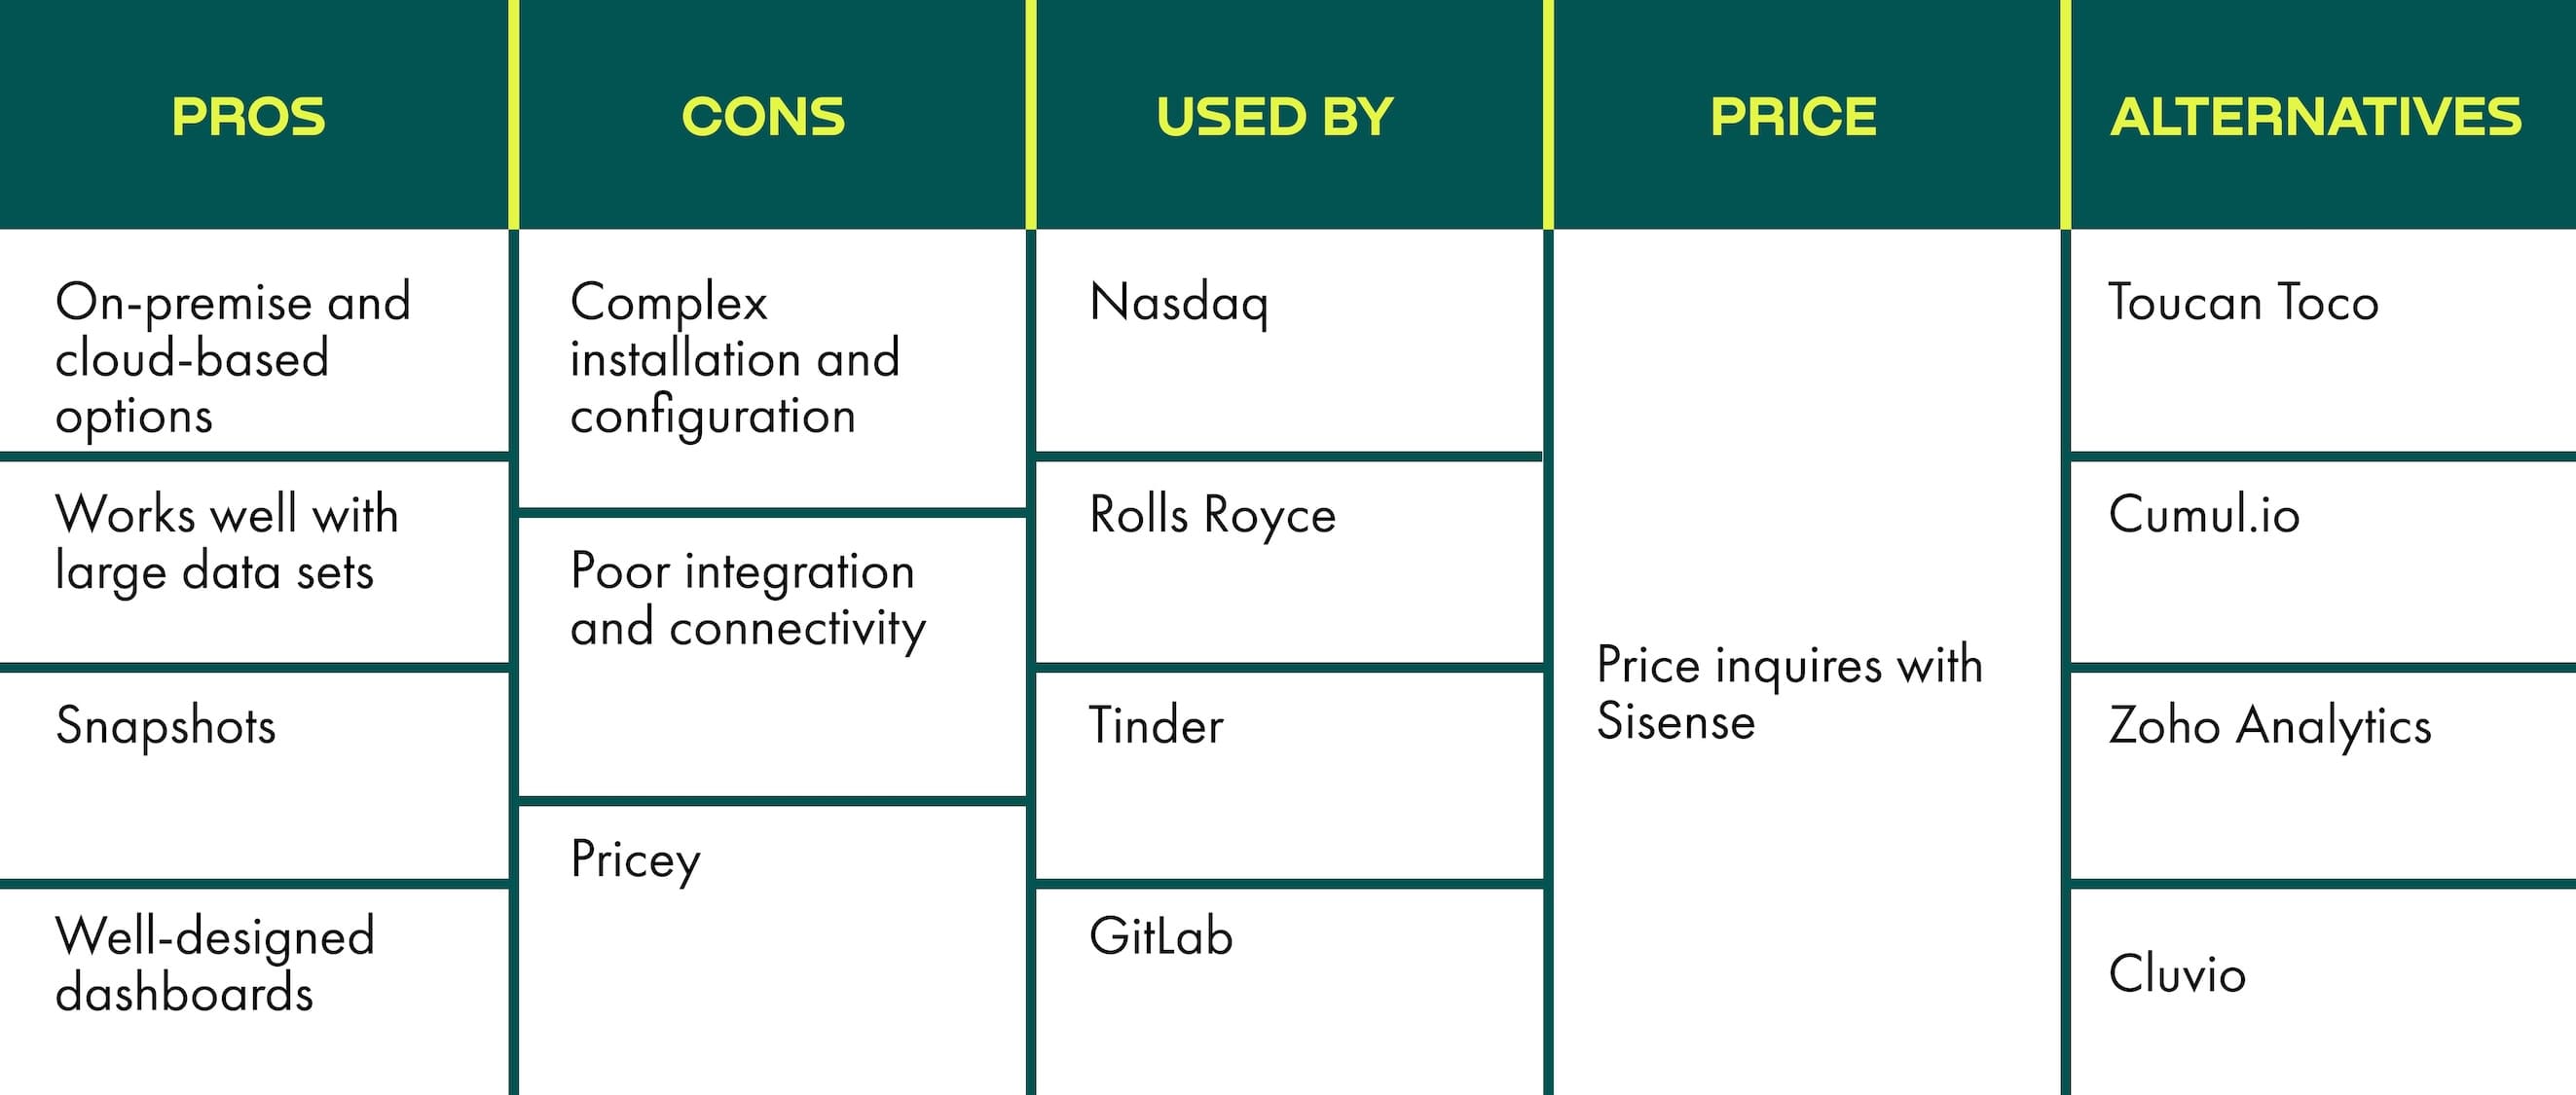
Sisense is a data analytics platform convenient for technical developers and business analysts. Within Sisense, they can enjoy large collections of drag-and-drop tools and interactive and collaborative dashboards. Its custom technology optimizes computation and can significantly increase processing speed.
Python
The open-source and widely adopted programming language.
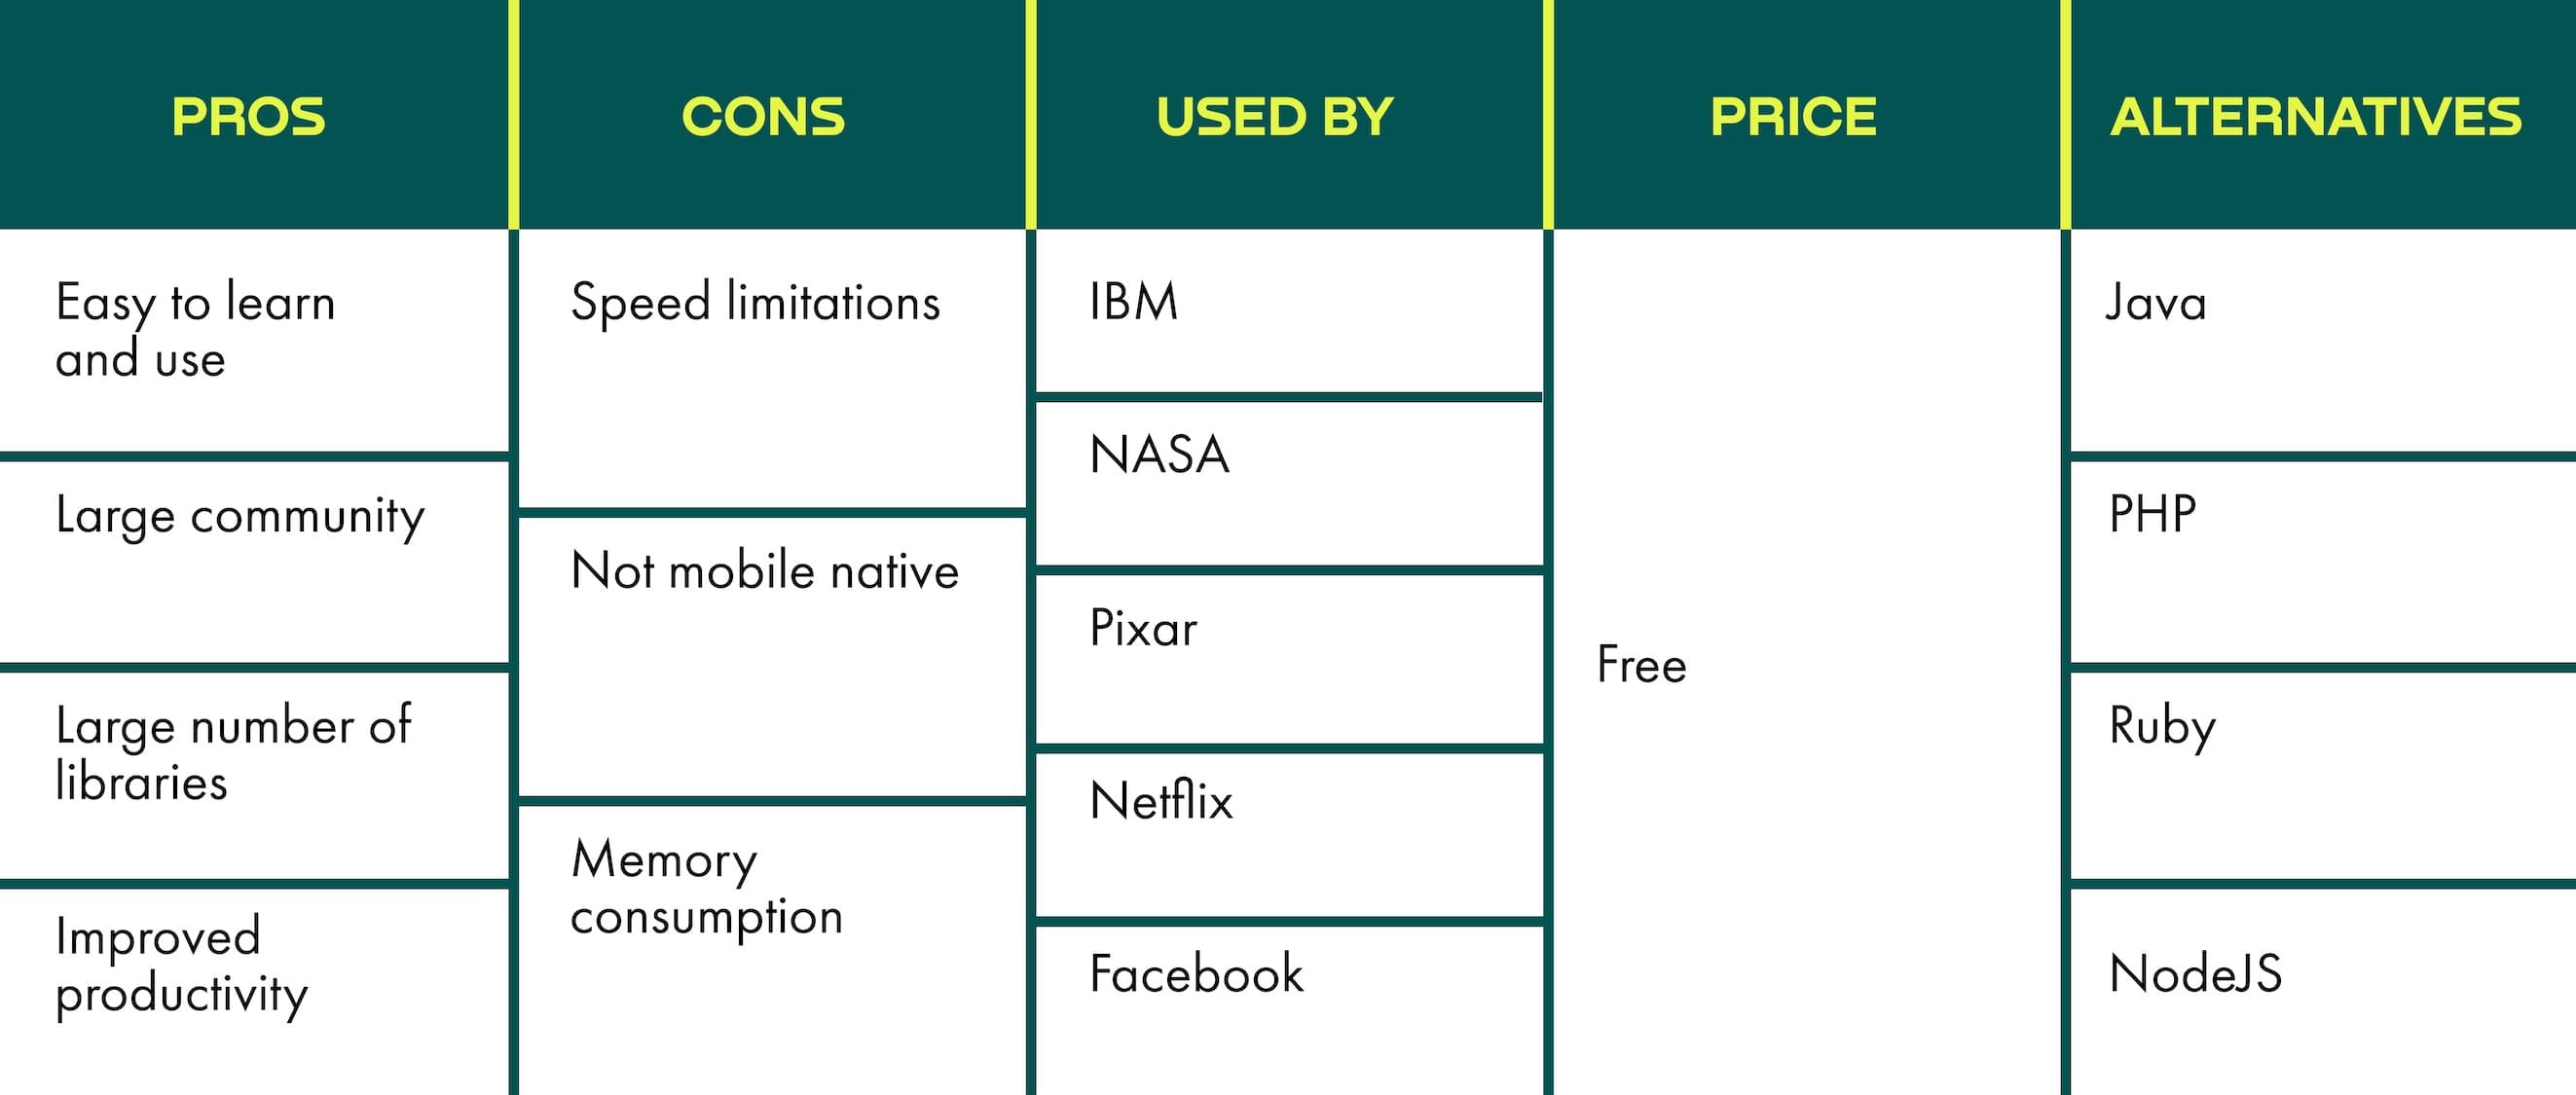
Python is an open-source, high-level programming language. As it is easy to learn and use, many technical analysts and data scientists adopt it. It means there is a large community of python users and all sorts of available helpful information out there. Python can handle many different analyses independently and integrate with many third-party data visualization packages. These include Matplotlib, Plotly, Seaborn, and others. It also has an extensive set of libraries that can assist with different analytics tasks. As mentioned above, though, its main disadvantage is speed and being memory intensive.
Bonus Recommendation
Hopefully, you've gained a deeper understanding of what to consider when searching for data analytics tools. If you've found something for yourself among the top 10 data analysis tools for effective data management, it's even better. Connect with their communities to learn more, or let us know what you liked best. If you’re ready to dig deeper into data analytics tools and techniques, check out some of our top courses for data analysis.